- Title
-
Chk1 Suppresses a Caspase-2 Apoptotic Response to DNA Damage that Bypasses p53, Bcl-2, and Caspase-3
- Authors
- Sidi, S., Sanda, T., Kennedy, R.D., Hagen, A.T., Jette, C.A., Hoffmans, R., Pascual, J., Imamura, S., Kishi, S., Amatruda, J.F., Kanki, J.P., Green, D.R., D'Andrea, A.A., and Look, A.T.
- Source
- Full text @ Cell
|
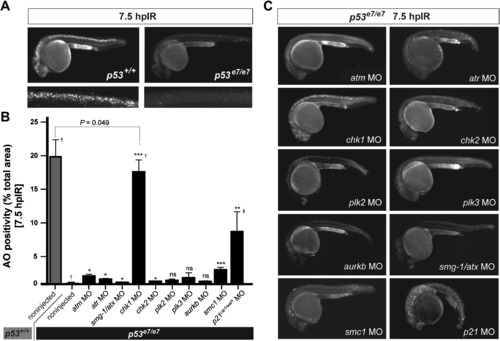
A Morpholino Screen Identifies chk1 as a Loss-of-Function Suppressor of p53e7/e7-Associated Radioresistance (A) Live 25 hpf embryos of the indicated genotypes stained with AO at 7.5 hpIR (12.5 Gy). Anterior, left. Note the complete absence of AO labeling in the brain and spinal cord of the irradiated p53 mutant. (B) MO screen for loss-of-function suppressors of p53e7/e7-associated radioresistance. Noninjected and 1 cell-stage MO-injected embryos were irradiated at 18 hpf (12.5 Gy). AO uptake by cells was quantified by analyzing images of whole embryos photographed live at 7.5 hpIR (y axis) (images as in C). Injected MOs are indicated along the x axis. Bars are color coded and refer to the genetic background used for injections (gray, p53+/+; black, p53e7/e7). AO staining was quantified in ≥8 embryos per knockdown, with 50 or more embryos scored per knockdown (except †> 1000); ‡, embryos showed developmental defects. All data are reported as means ± SEM. Statistical significance versus the noninjected p53e7/e7 response: * p < 0.05; ** p < 0.005; *** p < 0.0005; ns (not significant), (two-tailed Student's t test). (C) Fluorescent images of AO-labeled, live p53 mutants injected with indicated MOs and representative of the phenotypes quantified in (B). |
|
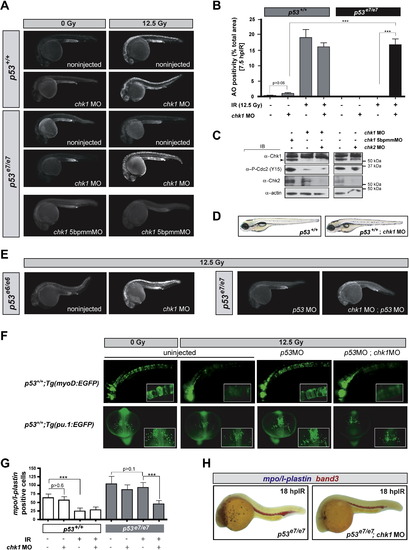
chk1 Knockdown Radiosensitizes p53 Mutants but Is Otherwise Compatible with Normal Zebrafish Development (A) Fluorescent images of representative embryos of indicated genotypes +/- chk1 MO after 0 or 12.5 Gy IR; 5bpmmMO (5 base pair mismatch MO). (B) Quantified AO responses of indicated genotypes with or without IR (12.5 Gy) and chk1 MO. Gray bars, p53+/+ background; black bars, p53e7/e7 background. AO staining was quantified in ≥8 embryos per condition, with > 1000 embryos scored. All data are reported as means ± SEM *** p < 0.0001 (two-tailed Student's t test). (C) Western blots comparing the levels of Chk1, Chk2, and phosphorylated Cdc2 (Tyr15) in protein lysates from 25.5 hpf embryos injected with the indicated MOs. (D) Nonirradiated p53+/+;chk1MO larva photographed live at 5 days postfertilization (dpf) show no apparent developmental defects but is slightly delayed (smaller swim bladder). Such larvae survived to adulthood. (E) Fluorescent images of representative irradiated embryos of indicated genotypes. p53e6 is the N168K mutation, corresponding to human residue 200. p53MO, MO against the p53 5′UTR. (F) Fluorescent images of live transgenic embryos injected with the indicated MOs at the 1-cell stage and expressing EGFP in the notochord (top row, embryos photographed at 24 hpf) or in myeloid progenitors (bottom row, embryos photographed at 16.5 hpf). Tg(myoD:EGFP) and Tg(pu.1:EGFP) embryos were treated with or without IR (12.5 Gy) at 18 hpf and 10 hpf, respectively. Insets, higher magnification views of GFP-expressing cells. Top row, lateral views, anterior to the left. Bottom row, dorsal views, anterior facing down. (G) Quantification of myeloid cells in 28 hpf embryos generated as indicated (x axis) and processed as in (H). Gray bars, p53+/+ background; black bars, p53e7/e7 background. mpo/l-plastin staining was quantified in ≥15 embryos per condition. Data are reported as means ± SD ** p < 0.001, *** p < 0.0001 (two-tailed Student's t test). Note that while the numbers of mpo/l-plastin-positive cells are reduced ∼3-fold in IR-treated versus untreated p53+/+ embryos; they are unchanged in treated versus untreated p53e7/e7 embryos. Also note that chk1 knockdown induces an average 2-fold reduction in myeloid cell numbers in the p53e7/e7 background after IR. (H) Images of representative 28 hpf embryos of indicated genotypes processed for in situ hybridization of mpo and l-plastin riboprobes (blue, differentiated granulocytes and monocytes) and band 3 (red, erythrocytes). Note the specific reduction in number of granulocytes/monocytes. EXPRESSION / LABELING:
PHENOTYPE:
|
|
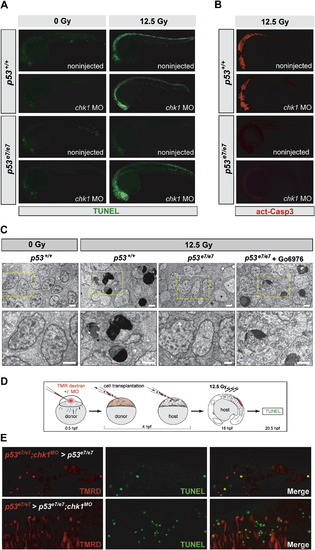
IR-induced p53-Independent Apoptosis after Chk1 Loss Occurs Cell Autonomously and Independently of Caspase-3 (A) Fluorescent images of 25 hpf embryos (anterior, left). TUNEL reactivity after IR (0 or 12.5 Gy) recapitulates live AO labeling (see Figure 2A). (B) Embryos from the same experiment immunostained with an antiactivated-Caspase-3 antibody. Note the absence of immunoreactivity in the irradiated p53e7/e7;chk1MO embryo. (C) Electron micrographs (sagittal sections) of the CNS in embryos of indicated genotypes after 0 or 12.5 Gy IR. Gö6976 is a specific Chk1 inhibitor (see Figure 5, Figure 6 and Figure 7). Lower row, 2.5x closeups on the areas boxed in yellow in upper panels. Note multiple cells with stereotypical chromatin compaction/segregation in columns 2 and 4, as opposed to healthy nuclei in columns 1 and 3. Organelles and plasma membrane are intact in the shown Chk1-inhibited irradiated p53 mutant cell, as expected from an apoptotic (as opposed to necrotic) event. See Figure S2 for more details. Scale bar, 2 μM. (D) Experimental procedure for the generation of the genetic chimeras shown in (E). (E) 5-μm-thick confocal sections of spinal cords in irradiated chimeras. TMR Dextran (red) marks the donor cells. TUNEL shown in green. First row, cells from a p53e7/e7 embryo that was injected with the chk1 MO at the 1-cell stage (p53e7/e7;chk1MO embryo) transplanted into a p53e7/e7 host. Second row, p53e7/e7 cells transplanted into a p53e7/e7;chk1MO host. |
|
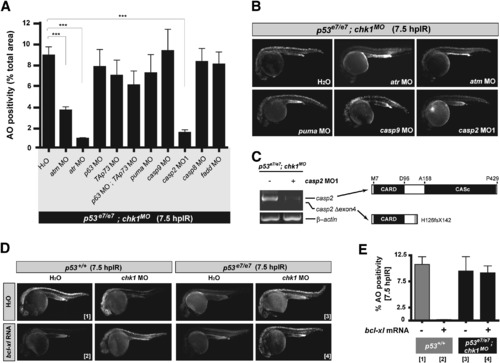
Genetic Dissection of the Zebrafish Chk1-Suppressed Apoptotic Pathway (A) Quantified AO labeling in spinal cords of 12.5 Gy-exposed p53e7/e7;chk1MO embryos injected with H2O (bar on the far left) or the indicated MOs (x axis). AO staining was quantified in e8 embryos per MO with a total of ≥100 embryos scored. All data are means ± SEM *** p < 0.0001 (two-tailed Student's t test). (B) Fluorescent images of representative embryos from the experiments shown in (A). (C) At left, RT-PCR of casp2 transcripts from embryos either injected or not injected with casp2 MO. At right, schematics of caspase-2 protein variants (top, wild-type protein; bottom, predicted protein translated from exon 4-deleted transcripts). (D) Fluorescent images of embryos of the indicated genotypes with or without IR (12.5 Gy at 18 hpf), chk1 MO, or bcl-xl mRNA. Numbers in brackets refer to the corresponding bars in (E). (E) Quantified AO responses (n ≥ 8) for embryos of indicated genotypes +/- bcl-xl mRNA. Gray bars, p53+/+ background; black bars, p53e7/e7;chk1MO background. Numbers in brackets refer to the representative-embryo images in (D). Data are means ± SEM. PHENOTYPE:
|
|
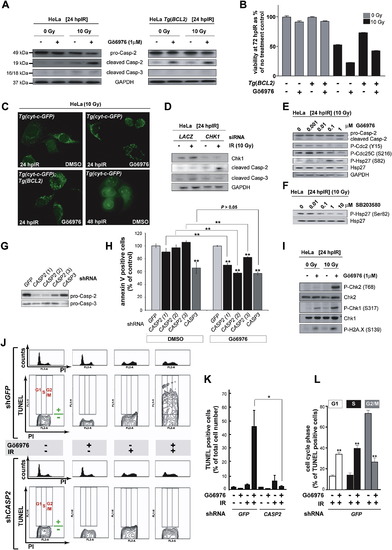
The Chk1-Suppressed Pathway Is Conserved in HeLa Cells (A) Western blots comparing the levels of caspase-2 (pro and cleaved forms) and cleaved caspase-3 at 24 hpIR in lysates from HeLa cells carrying or not carrying a BCL2 transgene (Tg[BCL2]) and treated with or without IR (10 Gy) or Chk1 inhibitor (Gö6976, 1 μM). (B) Analysis of HeLa cell survival at 72 hpIR (0 Gy versus 10 Gy) in the presence or absence of Gö6976 and/or BCL2. Gö6976 radiosensitizes the cells ∼2-fold regardless of the BCL2 transgene (compare bars 5 and 6, and bars 7 and 8). Note that BCL2 is functional (i.e., radioprotective) in these experiments (compare lanes 5 and 7). Data are means ± SEM. (C) Fluorescent images of HeLa Tg(Cyt-c-GFP) cells with or without Tg(BCL2) or Gö6976 at 24 or 48 hpIR (10 Gy). Note the punctate GFP patterns in all 24 hpIR samples and the diffuse GFP pattern in the 48 hpIR sample. (D) Levels of cleaved caspase-2 and caspase-3 at 24 hpIR (10 Gy) in HeLa cells transfected with LACZ or CHK1 siRNAs at 72 hr before IR. (E) Western blots comparing the activities of Chk1 (Cdc2 phosphorylation at Tyr15 and CDC25C phosphorylation at Ser216) and MK-2 (Hsp-27 phosphorylation at Ser82) following exposure to IR and increasing concentrations of Gö6976. (F) MK-2 phosphorylates Hsp-27 in HeLa cells. Western blot of lysates from irradiated HeLa cells exposed to increasing concentrations of the p38MAPK specific inhibitor SB203580 (Reinhardt et al., 2007), showing a dose-dependent reduction in phosphorylated Hsp-27. (G) Knockdown efficiencies of the indicated shRNAs as measured by western blots with anticaspase-2 and anticaspase-3 antibodies. (H) Effects of GFP, CASP2, and CASP3 shRNAs on apoptotic cell numbers at 48 hpIR as measured by AnnexinV (+) / PI (-) staining of HeLa cells treated with 10 Gy with or without Gö6976 (1 μM). For each shRNA, the average apoptotic cell number (given as % of GFP shRNA control) is shown. All data are means ± SD ** p < 0.01 (two-tailed Student's t test). Asterisks on top of bars refer to comparisons with GFP shRNA. (I) Synergistic activation of ATM and ATR by Gö6976 and IR. Western blots comparing the activities of ATM (Chk2 phosphorylation at Thr68) and ATR (Chk1 phosphorylation at Ser317) after 0 or 10 Gy IR with or without Gö6976 (1 μM). Levels of DNA damage were detected with an antiphospho-H2A.X antibody. (J) Cell-cycle distribution of HeLa cells undergoing Chk1-suppressed apoptosis. HeLa cells harboring GFP or CASP2 shRNAs and treated with or without 10 Gy IR with or without Gö6976 (1 μM), as indicated, were fixed at 48 hpIR and stained for TUNEL and PI. For each shRNA line, upper panels show PI-single histograms and lower panels show PI/TUNEL double-staining images. Cell-cycle phases and threshold for TUNEL positivity are indicated in red and green, respectively, in each no-treatment control images. (K) Quantification of the TUNEL stains shown in (J). Data are means ± SEM * p < 0.05 (two-tailed Student's t test). (L) Quantified data from experiment in (J) expressed as means ± SEM ** p < 0.002 (two-tailed Student's t test). White bars indicate cells dying in G1 phase. Black bars indicate cells dying in S phase. Grey bars, cells dying in G2 phase. |
|
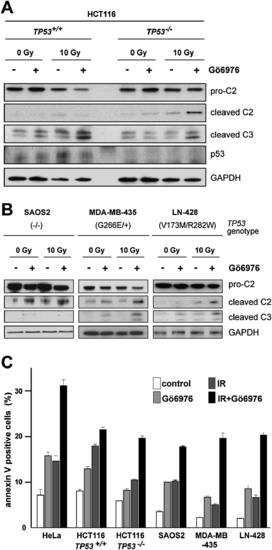
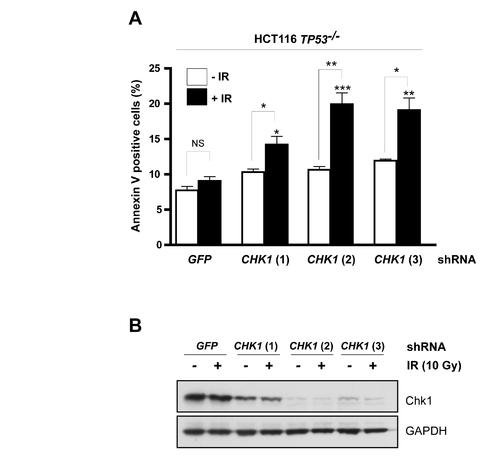
Influence of Genetic Background on Gö6976-Mediated Radiosensitization of Human Cancer Cells (A) Western blots comparing the levels of caspase-2 (pro and cleaved forms) and cleaved caspase-3 in 24-hpIR lysates from TP53+/+ and TP53-/- HCT116 cells that were treated with or without IR (10 Gy) or Gö6976 (1 μM). (B) Analysis as in (A) of the SAOS2 (left), MDA-MB-435 (middle), and LN-428 (right) lines. (C) Apoptotic cell numbers at 48 hpIR as measured by Annexin V (+) / PI (-) staining of the indicated cell lines treated with 0 or 10 Gy IR with or without Gö6976 (1 μM). Data are means ± SEM. See Figure S9 for a CHK1 shRNA-mediated phenocopy of Gö6976 in TP53-/- HCT116 cells. |
|
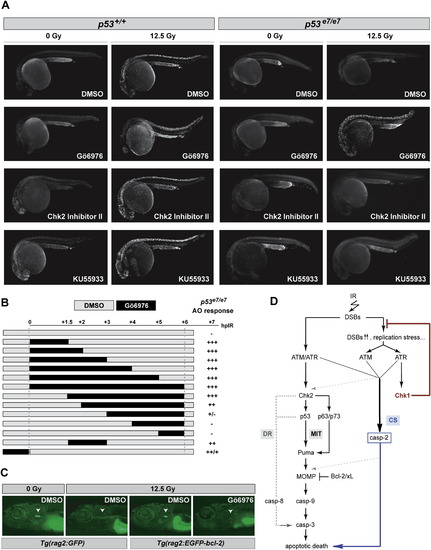
Effects of Gö6976 in Zebrafish In Vivo Models of p53 Loss and bcl-2 Gain (A) Fluorescent images of AO-labeled embryos of indicated genotypes photographed at 25.5 hpf. Embryos were exposed to 0 or 12.5 Gy IR and to the indicated drugs at 18 hpf. Gö6976, specific Chk1 inhibitor (1 μM). Chk2 Inhibitor II, specific Chk2 inhibitor (10 μM); KU55933, specific ATM inhibitor (10 μM). Note the range of toxicities in nonirradiated p53+/+ embryos treated with KU55933 or Chk2 Inhibitor II, with strong AO labeling preferentially localized in the brain and eyes (first column, third and fourth rows), as opposed to the Gö6976-treated embryo (first column, second row). Inversely, note the strong IR-induced AO labeling in the Gö6976-treated p53 mutant (last column, second row), but the lack of staining in the mutants treated with KU55933 or Chk2 Inhibitor II (last column, third and fourth rows). (B) Temporal requirement for Chk1 loss with respect to IR. p53 mutant embryos were exposed to Gö6976 for the indicated times. AO staining was quantified on a scale from “-” to “+++”with “-” representing the p53 mutant response and “+++” the response of sibling mutants treated with Gö6976 for 6 hr (∼500-fold greater response). (C) Fluorescent images of 9 dpf zebrafish larvae carrying the indicated transgene. Larvae were treated with 0 Gy or 15 Gy IR at 5 dpf and were exposed to Gö6976 (or DMSO as control) for a total of 5 days starting at 4 dpf. White arrowhead indicates the position of the thymus. Note the absence of detectable GFP in the Gö6976-treated Tg(rag2:EGFP-bcl-2) irradiated larva. (D) Simplified model for the vertebrate apoptotic response to DNA damage, highlighting the p53-independent pathway normally blocked by IR-activated Chk1 (CS, for Chk1-suppressed pathway), which is distinct from the classical intrinsic (mitochondrial, MIT) and extrinsic (death-receptor, DR) pathways. See text for details. PHENOTYPE:
|
|
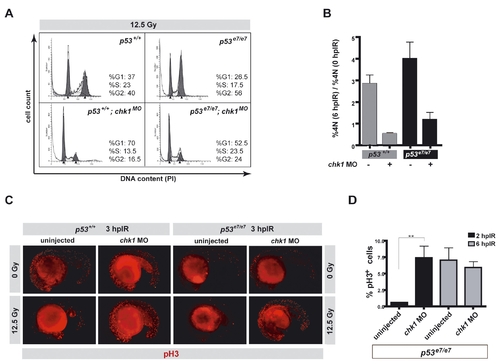
. Chk1 depletion eliminates the IR-induced G2/M checkpoint in zebrafish PHENOTYPE:
|
|
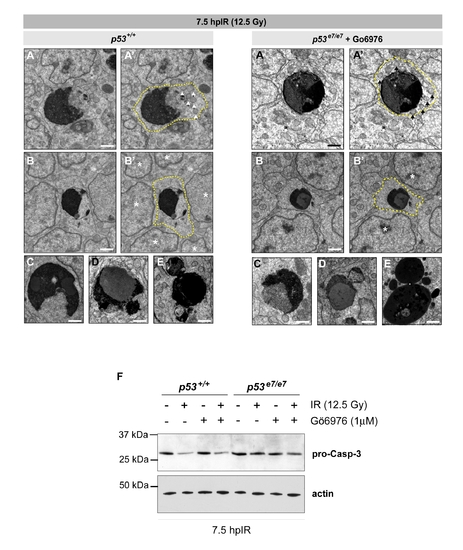
Cytologic hallmarks of apoptosis, but retention of elevated procaspase-3 levels, in irradiated Chk1-inhibited p53e7/e7 embryos |
|
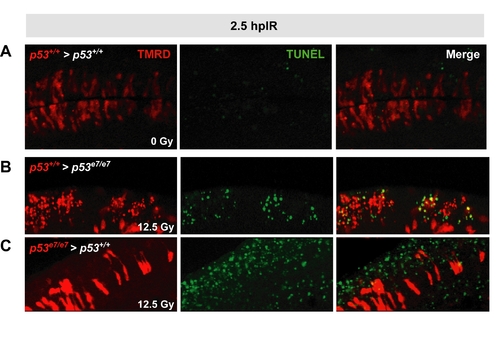
Validation of the cell transplantation assay |
|
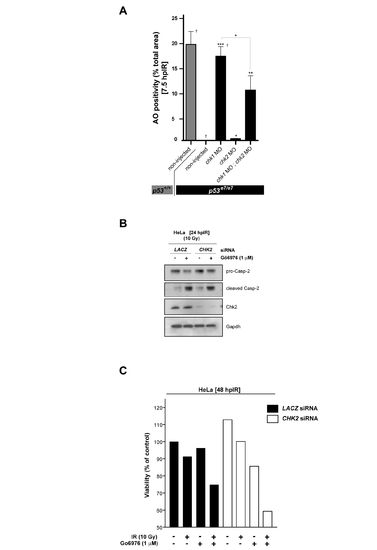
Chk1-suppressed apoptosis in both zebrafish embryos and human cancer cells is largely Chk2-independent PHENOTYPE:
|
|
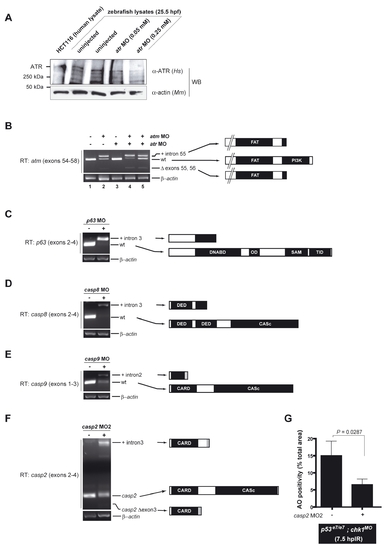
Knockdown efficiencies of selected MOs EXPRESSION / LABELING:
|
|
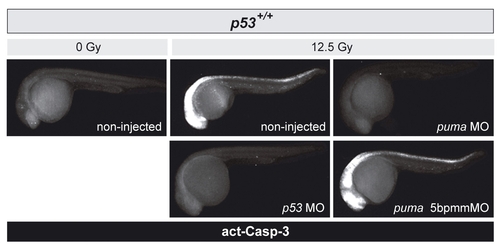
puma depletion abrogates IR-induced apoptosis in wild-type zebrafish embryos |
|
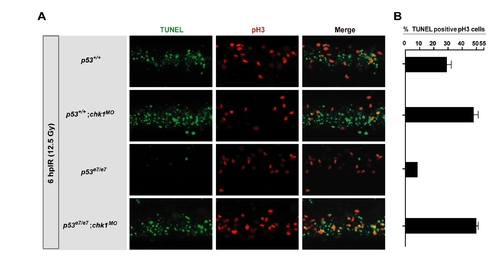
Chk1-suppressed apoptosis occurs predominantly during the interphase in zebrafish embryos |
|
CHK1 shRNAs phenocopy Gö6976 in HCT116 cells |
|
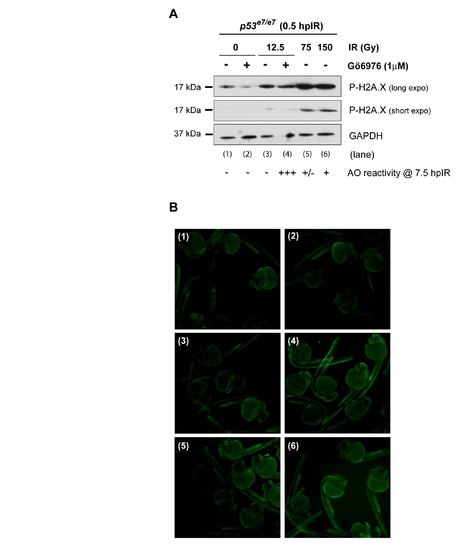
Extreme IR-induced DNA damage fails to force apoptosis in zebrafish p53 mutants endowed with wild-type Chk1 activity EXPRESSION / LABELING:
|
Reprinted from Cell, 133(5), Sidi, S., Sanda, T., Kennedy, R.D., Hagen, A.T., Jette, C.A., Hoffmans, R., Pascual, J., Imamura, S., Kishi, S., Amatruda, J.F., Kanki, J.P., Green, D.R., D'Andrea, A.A., and Look, A.T., Chk1 Suppresses a Caspase-2 Apoptotic Response to DNA Damage that Bypasses p53, Bcl-2, and Caspase-3, 864-877, Copyright (2008) with permission from Elsevier. Full text @ Cell

