
|
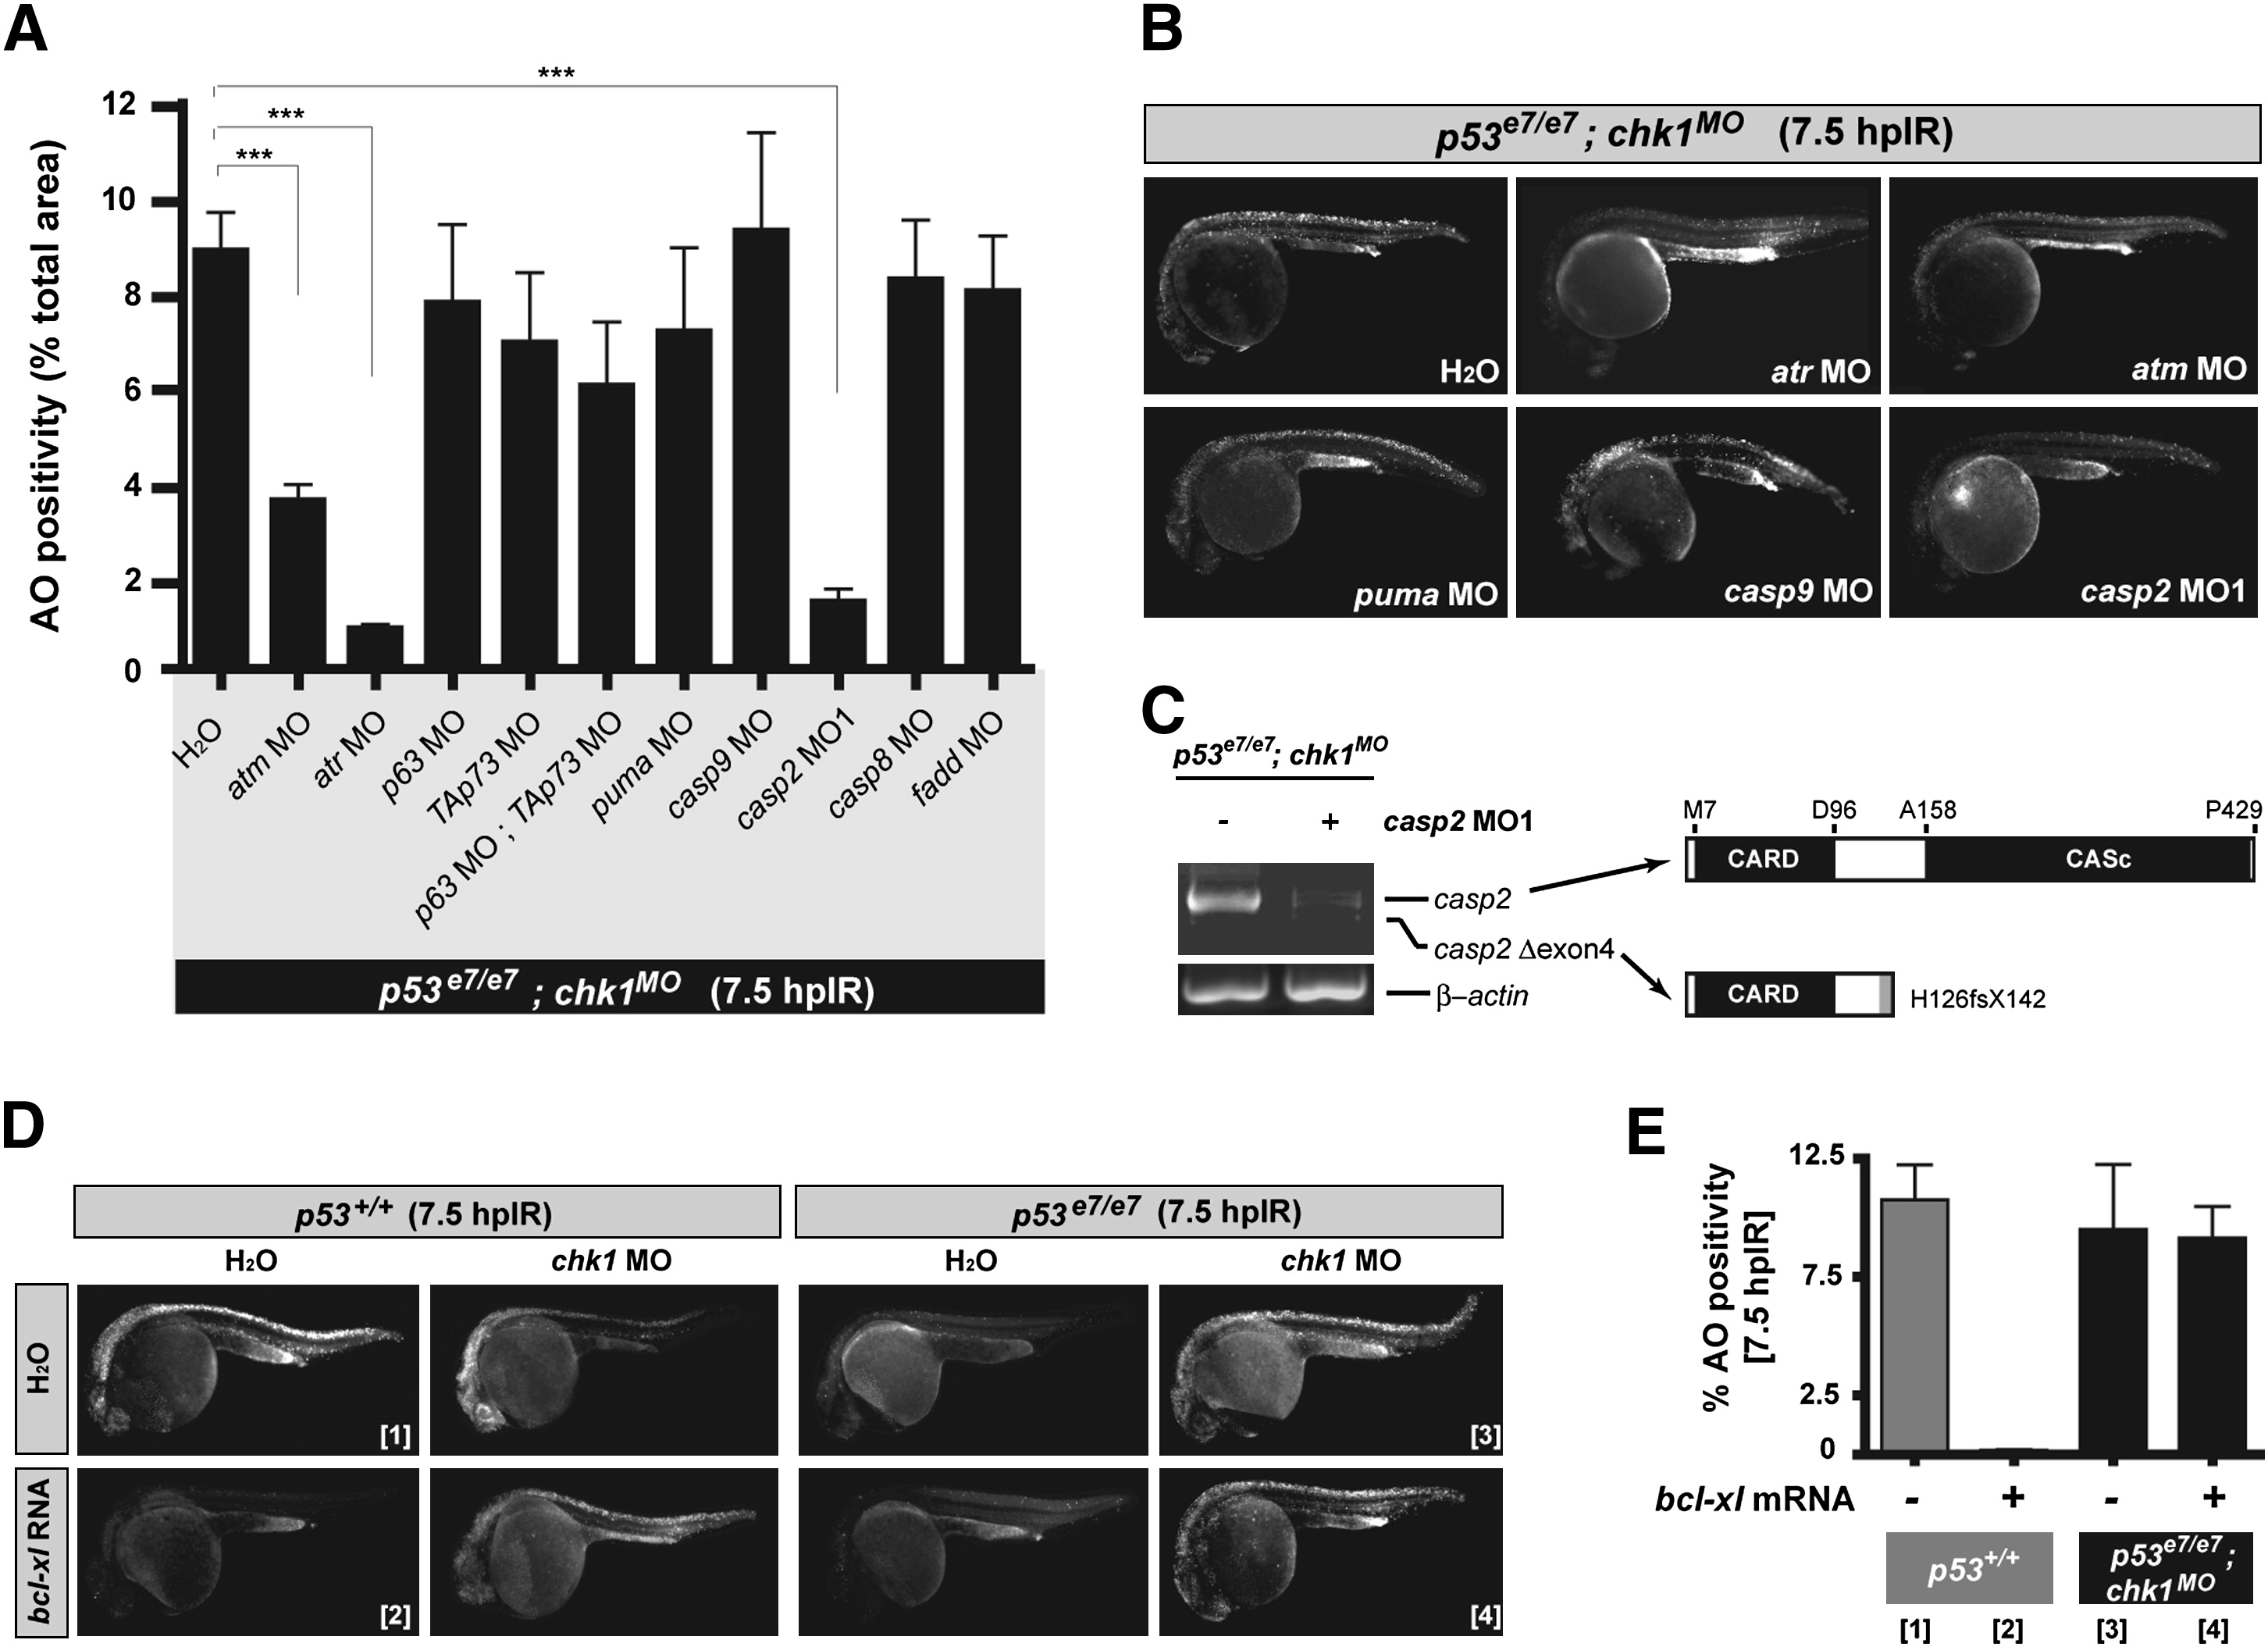
Fig. 4 Genetic Dissection of the Zebrafish Chk1-Suppressed Apoptotic Pathway
(A) Quantified AO labeling in spinal cords of 12.5 Gy-exposed p53e7/e7;chk1MO embryos injected with H2O (bar on the far left) or the indicated MOs (x axis). AO staining was quantified in e8 embryos per MO with a total of ≥100 embryos scored. All data are means ± SEM *** p < 0.0001 (two-tailed Student's t test).
(B) Fluorescent images of representative embryos from the experiments shown in (A).
(C) At left, RT-PCR of casp2 transcripts from embryos either injected or not injected with casp2 MO. At right, schematics of caspase-2 protein variants (top, wild-type protein; bottom, predicted protein translated from exon 4-deleted transcripts).
(D) Fluorescent images of embryos of the indicated genotypes with or without IR (12.5 Gy at 18 hpf), chk1 MO, or bcl-xl mRNA. Numbers in brackets refer to the corresponding bars in (E).
(E) Quantified AO responses (n ≥ 8) for embryos of indicated genotypes +/- bcl-xl mRNA. Gray bars, p53+/+ background; black bars, p53e7/e7;chk1MO background. Numbers in brackets refer to the representative-embryo images in (D). Data are means ± SEM.
Reprinted from Cell, 133(5), Sidi, S., Sanda, T., Kennedy, R.D., Hagen, A.T., Jette, C.A., Hoffmans, R., Pascual, J., Imamura, S., Kishi, S., Amatruda, J.F., Kanki, J.P., Green, D.R., D'Andrea, A.A., and Look, A.T., Chk1 Suppresses a Caspase-2 Apoptotic Response to DNA Damage that Bypasses p53, Bcl-2, and Caspase-3, 864-877, Copyright (2008) with permission from Elsevier. Full text @ Cell