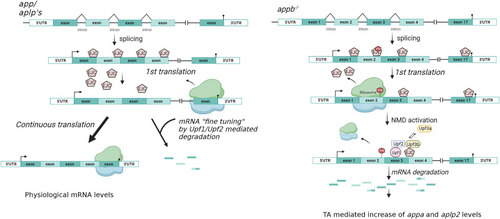
FIGURE SUMMARY
Title

Fine-tuning amyloid precursor protein expression through non-sense mediated mRNA decay

Authors
Rahmati, M., Chebli, J., Banote, R.K., Roselli, S., Agholme, L., Zetterberg, H., Abramsson, A.
Source
Full text @ eNeuro

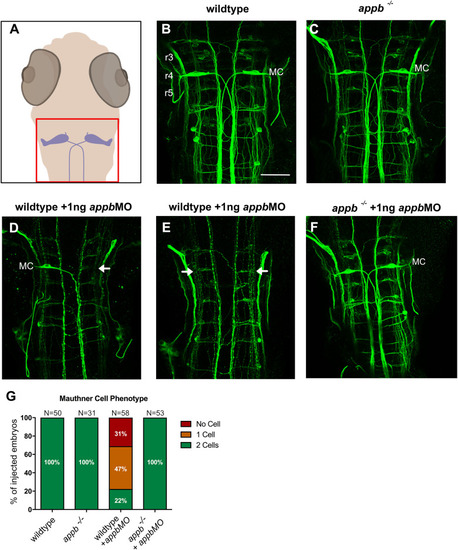
appbMO-mediated loss of Mauthner cells in wild type but not appb−/− zebrafish. A, Schematic image of the hindbrain region shown in B–F. B, C, Dorsal view of hindbrain of embryos (anterior to the top) stained with RMO44 antibody at 48 hpf, displaying the large Mauthner cells (MC) in wild type (B) and appb−/− (C). D, E, Wild-type larvae injected with 1 ng splice-blocking appbMO showed two (22%), one (47%, D), or no MC (31%, E). F, two MC were observed in all appb−/− injected with 1 ng splice-blocking appbMO. G, Quantification of the MC number at 48 hpf. G, n = 3 biologically independent samples. “N” indicates number of brains. r3–r5, rhombomeres 3–5. Scale bar, 50 μm. MC, Mauthner cells. Arrows indicate missing Mauthner cells.

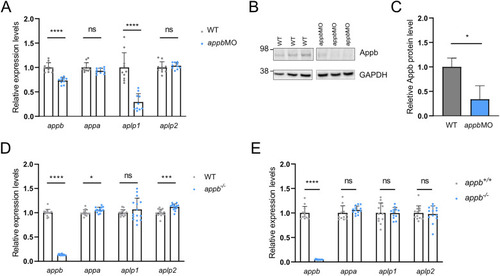
Relative gene expression in translation-blocking appbMO and appb−/−. A, Relative expression level of appa, appb, aplp2, and aplp1 (N = 10) in morphants compared with wild type (WT; N = 10) at 24 hpf. B, Western blot analysis of Appb and GAPDH levels in wild type and translation-blocking appbMO at 3 dpf. C, Quantification of Western blot data. D, Relative expression of appa, appb, aplp1, and aplp2 at 24 hpf in genetic appb−/− (N = 14) compared with WT (N = 14). E, Relative expression of appa, appb, aplp1, and aplp2 in adult brain of genetic appb−/− mutants (N = 13) and wild-type siblings (N = 12). Wild-type expression levels were set at 1. Data shown as mean + SD. A–E, n = 3 biologically independent samples. Student's two-tailed t test was used to calculate p values. *p < 0.05, **p < 0.01, ***p < 0.005, and ****p < 0.001. Additional data relating to these analyses are provided in Extended Data Figure 2-1.

Expression of app family genes in embryos injected with unstable or stable appb−/− mRNA. A, Injection of capped appb−/− RNA increases mRNA levels of appb but not mRNA level of appa, aplp1, or aplp2 compared with control eGFP RNA (N = 10–14). B, Injection of uncapped appb−/− RNA increases mRNA levels of appb and appa, compared with uncapped control eGFP RNA (N = 8–15). A, Bn = 3 biologically independent samples. Student's two-tailed t test was used to calculate p values. Wild-type expression levels were set to 1. Data shown as mean + SD. **p < 0.01 and ****p < 0.0001. ns, nonsignificant.

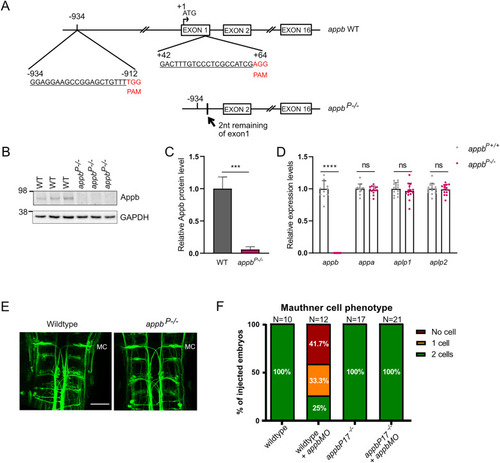
The RNA-less appbP mutation does not induce TA of other App family members. A, Deletion of exon 1 and the 5′ upstream sequence of appb was performed using two gRNAs binding −934 bp 5′ to and 64 bp 3′ of the ATG start, where A is considered as +1. gRNA target sequences are underlined, and PAM sequences are marked in red. B, Western blot analysis of Appb and GAPDH levels in wild type and appbP−/− at 3 dpf. C, Quantification of Western blot data. D, Relative expression levels of appa and appb (and Extended Data Fig. 4-1), aplp1, and aplp2 in appbP−/− (N = 15) and wild-type appbP+/+ siblings (N = 14). Ct values of appb in appbP−/− were above the detection threshold set to 40. E, RMO44 staining in hindbrain of wild-type and appbP−/− mutants at 48 hpf. F, Quantification of MC number in appbMO injected and noninjected wild type (WT) and appbP−/−. “N” indicates number of brains. MC, Mauthner cell. Scale bar, 50 μm. B, D, n = 3 biologically independent samples. F, n = 2–3 biologically independent samples. Wild-type expression levels were set at 1. Data shown as mean + SD. Student's two-tailed t test was used to calculate p values. ***p < 0.005 and ****p < 0.0001. ns, nonsignificant. Additional data relating to these analyses are provided in Extended Data Tables 4-14-3.

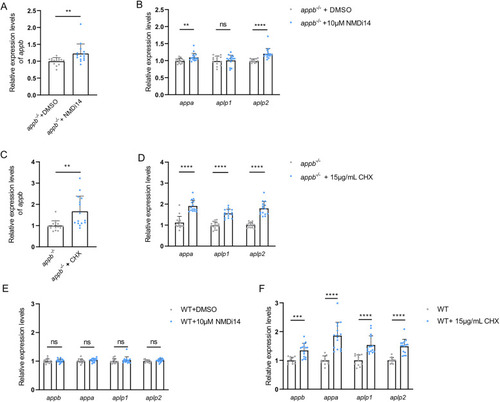
Expression of app family genes appb−/− and wild-type (WT) embryos after inhibition of NMD or translation and when knocking down of NMD core factors. A–D, Relative mRNA expression levels of appb, appa, aplp1, and aplp2 in appb−/− embryos treated with 0.1% DMSO or 10 μM NMDi14 between 24 and 48 hpf (N = 15) to inhibit nonsense-mediated mRNA decay (A,B) or with or without 15 μg/ml CHX between 24 and 29 hpf (N = 15) to block translation (C,D). E, F, Relative mRNA expression levels of appb, appa, aplp1, and aplp2 in wild-type (WT) embryos treated with 0.1% DMSO or 10 μM NMDi14 between 24 and 48 hpf (N = 15) (E) or with or without 15 μg/ml CHX between 24 and 29 hpf (N = 15) (F). A–F, n = 3 biologically independent samples. Data are shown as mean + SD. Student's two-tailed t test were used to calculate p values. *p < 0.05, **p < 0.01, ***p < 0.005, and ****p < 0.0001. ns, nonsignificant.

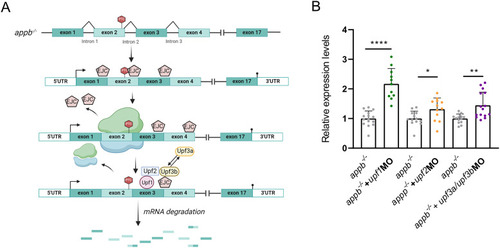
NMD pathway in appb−/−. A, Illustration of NMD pathway activation in appb−/−. EJC, the exon-junction complex; PTC, premature termination codon. B, Relative appb mRNA expression levels in appb−/− embryos injected with upf1MO (N = 12–15), upf2MO (N = 18–20), or upf3a/upf3bMO (N = 14–15) compared with uninjected appb−/−. n = 3 biologically independent samples. Data shown as mean + SD. Student's two-tailed t test were used to calculate p values. *p < 0.05, **p < 0.01, ***p < 0.005, and ****p < 0.0001. ns, nonsignificant. Additional data relating to these analyses are provided in Extended Data Figure 6-1.

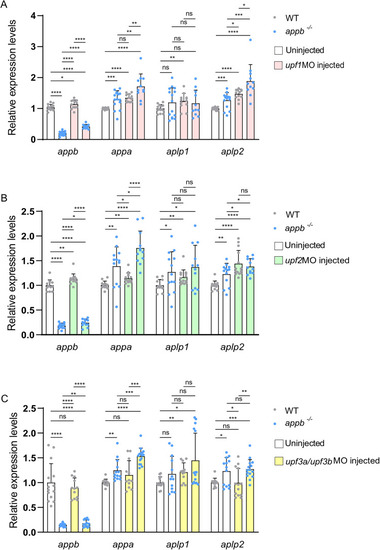
Expression of app family genes in wild-type and appb−/− embryos before and after knocking down NMD factors. A–C, Relative mRNA expression levels of appb, appa, aplp1, and aplp2 in uninjected wild-type embryos (N = 12–15), uninjected appb−/− (N = 13–15), wild type injected with upf1MO (N = 12), upf2MO (N = 14), upf3a/upf3bMO (N = 13), and appb−/− injected with upf1MO (N = 11), upf2MO (N = 12), and upf3a/upf3bMO (N = 15). n = 3 biologically independent samples. Data shown as mean + SD. Student's two-tailed t test were used to calculate p values. *p < 0.05, **p < 0.01, ***p < 0.005, and ****p < 0.0001. ns, nonsignificant.

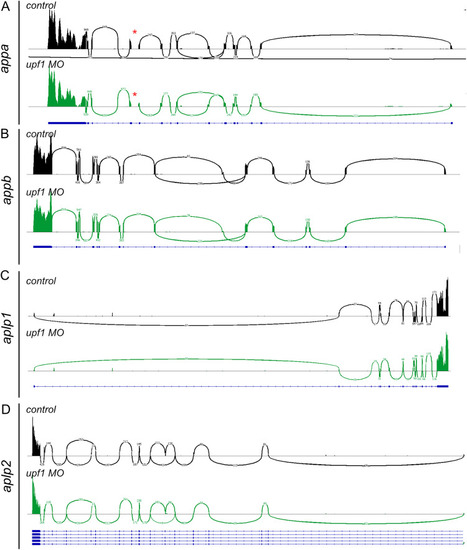
Sashimi plots of app family members in wild-type controls and upf1 morpholino injected larvae at 24 hpf. A–D, Splicing of appa (A), appb (B), aplp1 (C), and aplp2 (D) are shown in wild-type controls (black) and upf1 morpholino injected (green) larvae. Numbers indicate number of RNAseq reads and reference gene is outlined in blue. Red star indicates lack of splice junction between exons in appa. Additional data relating to these analyses are provided in Extended Data Figure 8-1 and Extended Data Table 8-1.

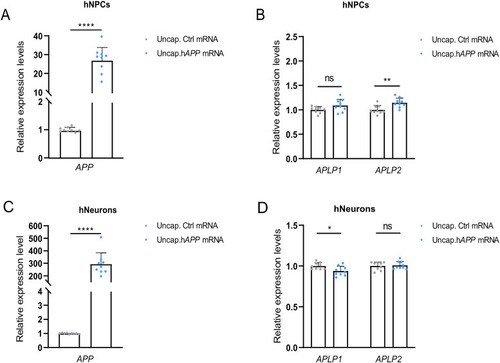
TA in hNPCs but not in terminally differentiated neuron cells transfected with unstable hAPP695 mRNA. A, Relative APP level in hNPCs transfected with uncapped eGFP (control) or hAPP695 mRNA (N = 9). B, APLP1 and APLP2 levels in hNPCs transfected with uncapped eGFP (control) or hAPP695 mRNA (N = 9). C, Relative APP level in human neuron cells transfected with uncapped eGFP or hAPP695 mRNA (N = 9). D, Relative mRNA level of APLP1 and APLP2 in terminally differentiated neuron cells transfected with uncapped eGFP or hAPP695 mRNA (N = 13). APP in control eGFP transfected cells were set at 1. A–D, n = 3 biologically independent samples. Data are mean + SD. Student's t test was used to calculate p values. *p < 0.05, **p < 0.01, ***p < 0.005, and ****p < 0.0001. ns, nonsignificant.

NMD pathway. A, B, Illustration of the mediated mRNA regulation of app family members under physiological conditions (A) and in appb mutants (B).

Acknowledgments
This image is the copyrighted work of the attributed author or publisher, and ZFIN has permission only to display this image to its users. Additional permissions should be obtained from the applicable author or publisher of the image. Full text @ eNeuro