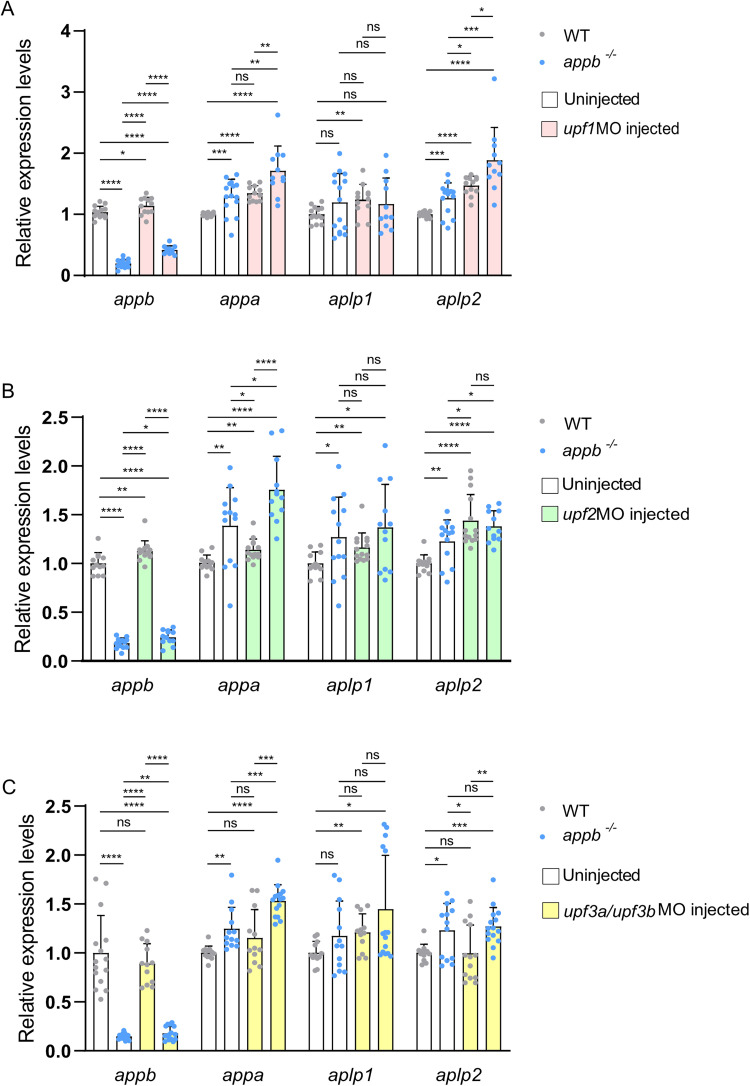
IMAGE

Figure 7.

ID
ZDB-IMAGE-240612-8
Source
Figures for Rahmati et al., 2024
Image
Figure Caption

Figure 7.

Expression of app family genes in wild-type and appb−/− embryos before and after knocking down NMD factors. A–C, Relative mRNA expression levels of appb, appa, aplp1, and aplp2 in uninjected wild-type embryos (N = 12–15), uninjected appb−/− (N = 13–15), wild type injected with upf1MO (N = 12), upf2MO (N = 14), upf3a/upf3bMO (N = 13), and appb−/− injected with upf1MO (N = 11), upf2MO (N = 12), and upf3a/upf3bMO (N = 15). n = 3 biologically independent samples. Data shown as mean + SD. Student's two-tailed t test were used to calculate p values. *p < 0.05, **p < 0.01, ***p < 0.005, and ****p < 0.0001. ns, nonsignificant.

Acknowledgments
This image is the copyrighted work of the attributed author or publisher, and ZFIN has permission only to display this image to its users. Additional permissions should be obtained from the applicable author or publisher of the image. Full text @ eNeuro