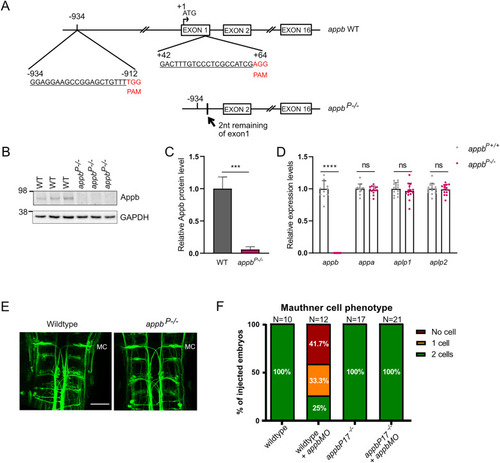
The RNA-less appbP mutation does not induce TA of other App family members. A, Deletion of exon 1 and the 5′ upstream sequence of appb was performed using two gRNAs binding −934 bp 5′ to and 64 bp 3′ of the ATG start, where A is considered as +1. gRNA target sequences are underlined, and PAM sequences are marked in red. B, Western blot analysis of Appb and GAPDH levels in wild type and appbP−/− at 3 dpf. C, Quantification of Western blot data. D, Relative expression levels of appa and appb (and Extended Data Fig. 4-1), aplp1, and aplp2 in appbP−/− (N = 15) and wild-type appbP+/+ siblings (N = 14). Ct values of appb in appbP−/− were above the detection threshold set to 40. E, RMO44 staining in hindbrain of wild-type and appbP−/− mutants at 48 hpf. F, Quantification of MC number in appbMO injected and noninjected wild type (WT) and appbP−/−. “N” indicates number of brains. MC, Mauthner cell. Scale bar, 50 μm. B, D, n = 3 biologically independent samples. F, n = 2–3 biologically independent samples. Wild-type expression levels were set at 1. Data shown as mean + SD. Student's two-tailed t test was used to calculate p values. ***p < 0.005 and ****p < 0.0001. ns, nonsignificant. Additional data relating to these analyses are provided in Extended Data Tables 4-1–4-3.
|

