FIGURE SUMMARY
Title

Zebrafish tsc1 and cxcl12a increase susceptibility to mycobacterial infection

Authors
Wright, K., Han, D.J., Song, R., de Silva, K., Plain, K.M., Purdie, A.C., Shepherd, A., Chin, M., Hortle, E., Wong, J.J., Britton, W.J., Oehlers, S.H.
Source
Full text @ Life Sci Alliance

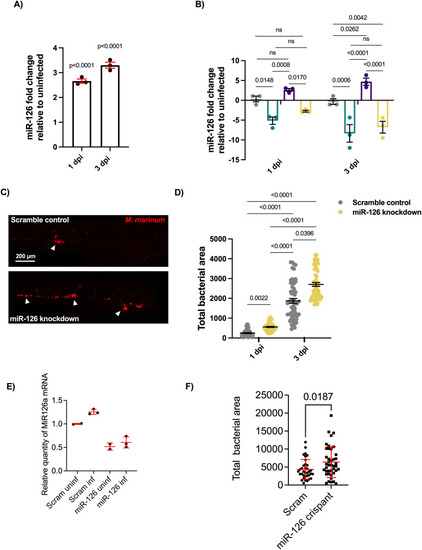
Infection-induced miR-126 expression alters bacterial burden.

(A) Expression of miR-126 after M. marinum infection analysed by RT-qPCR at 1 and 3 dpi relative to uninfected embryos. (B) Expression of miR-126 in uninfected and infected, antagomir-injected (miR-126 knockdown), and scramble-injected embryos. (C) Representative images of M. marinum infection at 3 dpi in scramble control and miR-126 knockdown embryos. Scale bar represents 200 μm. (D)M. marinum burden in miR-126 knockdown embryos at 1 and 3 dpi. (E) Expression of miR-126 in uninfected and infected gRNA/Cas9-injected embryos at 5 dpi. (F)M. marinum burden in miR-126 crispant embryos at 5 dpi. Data information: each data point represents a single measurement, with the mean and SEM shown. For RT-qPCR analysis, each data point represents 10 embryos and contains three biological replicates. Bacterial burden analysis data points represent individual embryos (n = 40–50 embryos per group) and are representative of two experimental replicates.

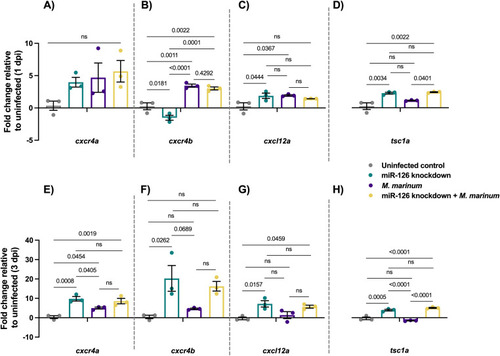
Expression of potential miR-126 mRNA targets is conserved in zebrafish M. marinum infection.

(A) Expression of cxcr4a at 1 dpi in miR-126 knockdown measured by RT-qPCR relative to uninfected scramble control embryos. (B) Expression of cxcr4b at 1 dpi in miR-126 knockdown measured by RT-qPCR relative to uninfected scramble control embryos. (C) Expression of cxcl12a at 1 dpi in miR-126 knockdown measured by RT-qPCR relative to uninfected scramble control embryos. (D) Expression of tsc1a at 1 dpi in miR-126 knockdown measured by RT-qPCR relative to uninfected scramble control embryos. (E) Expression of cxcr4a at 1 dpi in miR-126 knockdown measured by RT-qPCR relative to uninfected scramble control embryos. (F) Expression of cxcr4b at 1 dpi in miR-126 knockdown measured by RT-qPCR relative to uninfected scramble control embryos. (G) Expression of cxcl12a at 1 dpi in miR-126 knockdown measured by RT-qPCR relative to uninfected scramble control embryos. (H) Expression of tsc1a at 1 dpi in miR-126 knockdown measured by RT-qPCR relative to uninfected scramble control embryos. Data information: each data point represents a single measurement of 10 pooled embryos and two technical replicates, with the mean and SEM shown and comparisons calculated by one-way ANOVA.

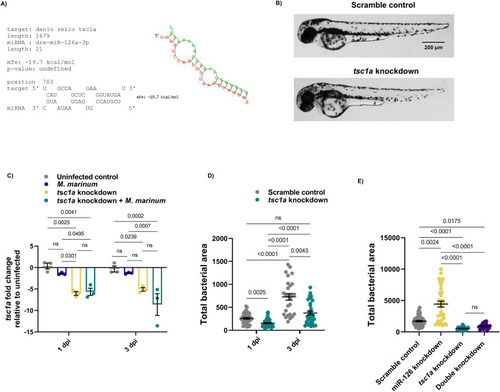
miR-126 potentially targets tsc1a to worsen M. marinum infection burden.

(A) Binding kinetics of tsc1a and dre-miR-126a-3p as predicted by RNAhybrid. (B) Brightfield images of tsc1a knockdown embryos at 3 dpf showing no abnormal developmental phenotypes. Scale bar represents 200 μm. (C)tsc1a expression was measured by RT-qPCR at 1 and 3 dpi after CRISPR-Cas9 knockdown of tsc1a and infection with M. marinum. (D)tsc1a knockdown and scramble control embryos were infected with M. marinum via caudal vein injection, and the bacteria burden was analysed at 1 and 3 dpi. (E)tsc1a and miR-126 double knockdown embryos were infected with M. marinum via caudal vein injection, and bacterial burden was analysed at 3 dpi. Data information: for RT-qPCR analysis, data points are representative of a single measurement of 10 pooled embryos and two technical replicates, with the mean and SEM shown and comparisons calculated by one-way ANOVA. (C, D) Bacterial burden data points represent a single measurement (n = 27–44 embryos per group (C) and n = 11–20 embryos per group (D)), and two experimental replicates with the mean and SEM are shown and comparisons calculated by one-way ANOVA.

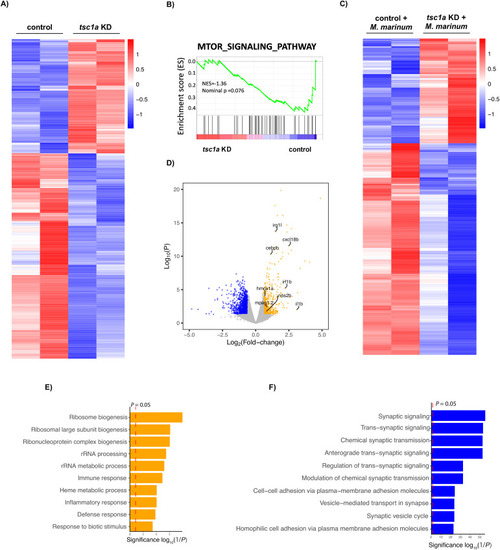
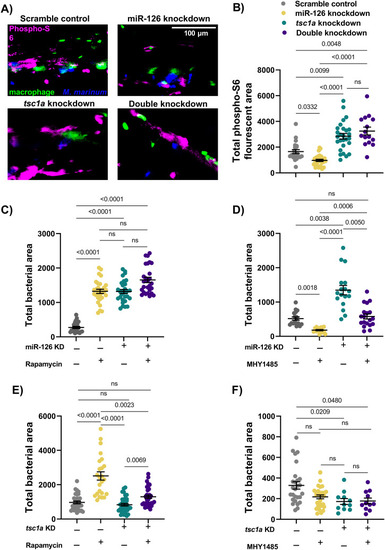
Modulation of Tsc1 alters key host defence and inflammatory pathways.

(A) Heatmap of differentially expressed genes (DEGs) identified by RNA sequencing of 3 dpf embryos after CRISPR-Cas9 knockdown of tsc1a. (B) Enrichment score mapping to the term MTOR signalling pathway of DEG identified by RNA sequencing of 3 dpf embryos after CRISPR-Cas9 knockdown of tsc1a. (C) Heatmap of DEGs identified by RNA sequencing of 3 dpi embryos after CRISPR-Cas9 knockdown of tsc1a and infection with M. marinum. (D) Volcano plot of DEGs identified by RNA sequencing of 3 dpi embryos after CRISPR-Cas9 knockdown of tsc1a and infection with M. marinum. Up-regulated host defence and inflammatory pathway genes are annotated. (E, F) Gene ontology analysis was performed on DEGs identified by RNA sequencing of 3 dpi embryos after CRISPR-Cas9 knockdown of tsc1a and infection with M. marinum to identify key downstream pathways either increased (E) or decreased (F) in tsc1a crispants.

miR-126 acts on tsc1a to influence mTOR signalling during infection.

(A) Representative images of phospho-S6 fluorescent staining in miR-126 and tsc1a knockdown embryos at 1 dpi. M. marinum is blue, macrophages are green, and phosphorylated ribosomal protein S6 is magenta. Scale bar represents 100 μm. (B) Phospho-S6 staining in M. marinum–infected scramble control, miR-126 knockdown, and tsc1a knockdown at 1 dpi. (C) miR-126 knockdown embryos were infected with M. marinum via caudal vein injection and treated with mTOR inhibitor rapamycin. Bacterial burden was analysed at 1 dpi. (D) miR-126 knockdown embryos were infected with M. marinum via caudal vein injection and treated with mTOR activator MHY1485. (E)tsc1a knockdown embryos were infected with M. marinum via caudal vein injection and treated with mTOR inhibitor rapamycin. Bacterial burden was analysed at 1 dpi. (F)tsc1a knockdown embryos were infected with M. marinum via caudal vein injection and treated with mTOR activator MHY1485. Bacterial burden was analysed at 1 dpi. Data information: each data point represents a single measurement (n = 11–36 embryos per group) with the mean and SEM shown. Phospho-S6 staining is a single experimental replicate, whereas rapamycin and MHY1485 treatments represent two experimental replicates each.

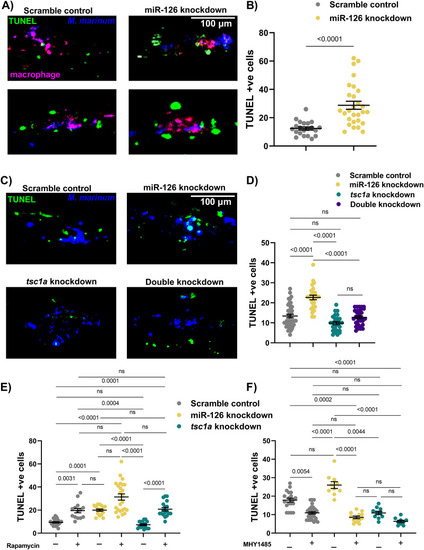
Decreased mTOR signalling alters cell death dynamics in mycobacterial infection.

(A) Representative images of TUNEL staining in miR-126 knockdown embryos at 3 dpi. TUNEL +ve cells are green, macrophages are magenta, and M. marinum is blue. Scale bar represents 100 μm. (B) TUNEL +ve cells in M. marinum–infected scramble control and miR-126 knockdown embryos were counted at 3 dpi. (C) Representative images of TUNEL staining in tsc1a and double knockdown embryos at 3 dpi. TUNEL +ve cells are green, and M. marinum is blue. Scale bar represents 100 μm. (D) TUNEL +ve cells in M. marinum–infected tsc1a and double knockdown embryos were counted at 3 dpi. (E) TUNEL +ve cells in rapamycin-treated, M. marinum–infected knockdown embryos were counted at 3 dpi. (F) TUNEL +ve cells in MHY1485-treated, M. marinum–infected knockdown embryos were counted at 3 dpi. Data information: each data point represents a single measurement, with the mean and SEM shown (n = 20–25 embryos per group). Graphs are representative of two experimental replicates with the exception of rapamycin/MHY1485 experiments, which were performed in a single replicate.

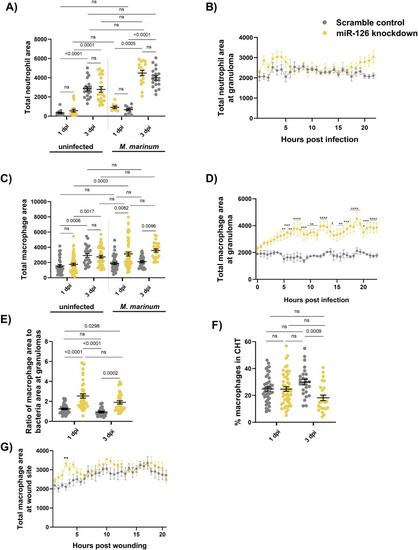
Mycobacterial infection-induced miR-126 expression alters the host macrophage response.

(A) Measurement of whole-body neutrophil fluorescent area at 1 and 3 dpi in scramble control and miR-126 knockdown uninfected and infected embryos. (B) Measurement of neutrophil levels after trunk infection with M. marinum in miR-126 knockdown embryos. (C) Measurement of whole-body macrophage fluorescent area at 1 and 3 dpi in uninfected and infected miR-126 knockdown embryos. (D) Measurement of macrophage levels after trunk infection with M. marinum in miR-126 knockdown embryos. (E) Ratio of macrophage fluorescent area per bacterial fluorescent area at granulomas in miR-126 knockdown embryos at 1 and 3 dpi. (F) Percent of macrophages residing in the caudal haematopoietic tissue in scramble control and miR-126 knockdown embryos at 1 and 3 dpi. (G) Measurement of macrophage recruitment to a tail wound in miR-126 knockdown embryos. Data information: each data point represents a single measurement with the mean and SEM shown. For neutrophil analysis, 10–20 embryos per group were analysed and 15–50 embryos per group for macrophage analysis. For neutrophil time-lapse imaging, each data point represents the mean of six foci of infection from six separate embryos, and the graph is representative of two experimental replicates. For macrophage time-lapse imaging, each data point represents the mean of three foci of infection from three separate embryos, and the graph is representative of two experimental replicates. *P < 0.05, **P < 0.01, ***P < 0.001, ****P < 0.0001.

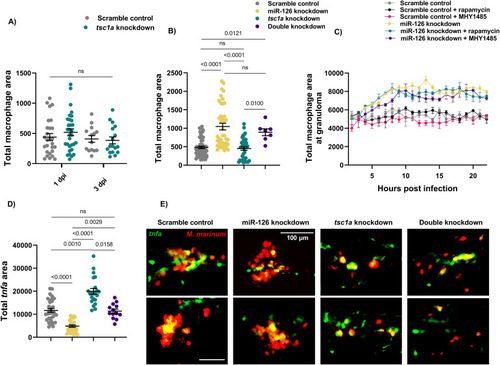
miR-126–dependent macrophage responses to infection are not controlled by the Tsc1a/mTOR signalling axis.

(A) Measurement of whole-body macrophage fluorescent area at 1 and 3 dpi in M. marinum–infected scramble control and tsc1a knockdown embryos. (B) Measurement of whole-body macrophage fluorescent area at 1 dpi in M. marinum–infected scramble control and knockdown embryos. (C) Measurement of macrophage levels after trunk infection with M. marinum in miR-126 knockdown and control embryos and treatment with either MHY1485 or rapamycin. (D) Measurement of tnfa promoter activation after trunk infection with M. marinum in knockdown embryos at 1 dpi infected with M. marinum via caudal vein injection and bacterial burden was analysed at 3 dpi. (E) Representative images of tnfa promoter-driven GFP expression at 1 dpi in knockdown embryos after trunk infection with M. marinum. M. marinum is red, and tnfa is green. Scale bar represents 100 μm. Data information: each data point represents a single measurement, with the mean and SEM shown (n = 9–56) embryos per group. Graphs are representative of two experimental replicates. For macrophage time-lapse imaging, each data point represents the mean of three foci of infection from three separate embryos.

Mycobacterial infection-induced miR-126 expression increases proinflammatory bactericidal macrophage recruitment.

(A, B) Expression of ccr2 and ccl2 was analysed by RT-qPCR at 1 dpi after miR-126 knockdown and infection with M. marinum. Expression is relative to uninfected scramble control embryos. Data information: each data point is representative of a single measurement of 10 pooled embryos and two technical replicates, with the mean and SEM shown and comparisons calculated by one-way ANOVA.

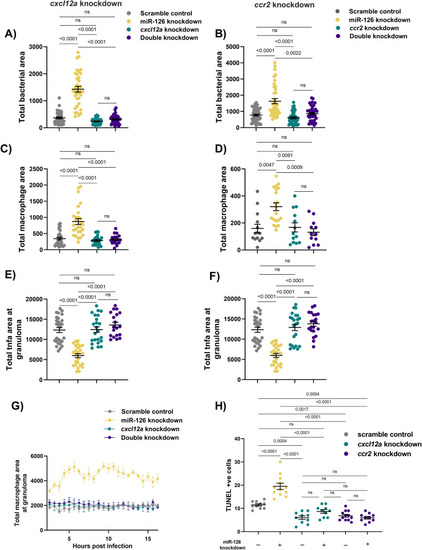
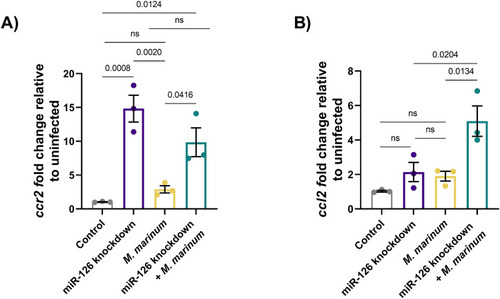
Infection-induced miR-126 regulates Cxcl12/Ccl2/Ccr2 signalling to restrict macrophage recruitment to sites of infection.

(A, B) Bacterial burden measured at 1 dpi in miR-126 and cxcl12a (A) or ccr2 (B) knockdown embryos infected with M. marinum. (C, D) Whole-body macrophage levels measured at 1 dpi in miR-126 and cxcl12a (C) or ccr2 (D) knockdown embryos infected with M. marinum. (E, F)tnfa fluorescent area at sites of infection measured at 1 dpi in miR-126 and cxcl12a (E) and ccr2 (F) knockdown embryos infected with M. marinum. (G) Measurement of macrophage levels after trunk infection with M. marinum in miR-126 knockdown and cxcl12a embryos. (H) TUNEL +ve cells counted at 3 dpi in miR-126 and cxcl12a or ccr2 knockdown embryos infected with M. marinum. Data information: each data point represents a single measurement, with the mean and SEM shown (n = 10–45) embryos per group. Bacterial burden, macrophage analysis, and granuloma tnfa graphs are representative of two experimental replicates, whereas TUNEL staining is presented as a single replicate. For macrophage time-lapse imaging, each data point represents the mean of three foci of infection from three separate embryos.

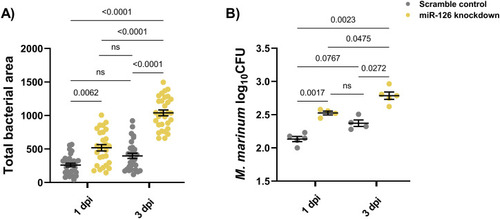
Comparison of infectious burden measurements in scramble control and miR-126 knockdown embryos at 1 and 3 dpi.

(A) Bacterial burden measured by fluorescent bacterial area method. (B) Bacterial recovery CFU measurement. For bacterial burden measurement, each data point represents a single embryo and comparisons calculated by a Kruskal–Wallis test. For CFU analysis, each data point represents five pooled embryos and comparisons calculated by one-way ANOVA. For both graphs, the mean and SEM are shown.

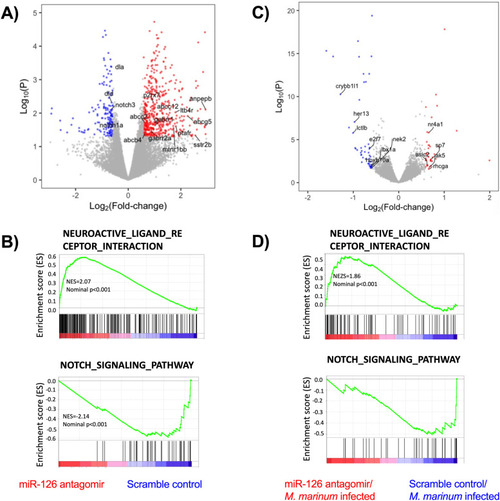
Modulation of miR-126 alters neural and notch signaling pathways.

(A) Volcano plot of differentially expressed genes (DEGs) identified by RNA sequencing of 3 dpi embryos after antagomir knockdown of miR-126. Up-regulated neurobiology genes and down-regulated notch pathway genes are annotated. (B) Enrichment score mapping to the terms neuroactive ligand receptor interaction and Notch signalling pathway of DEGs identified by RNA sequencing of 3 dpf embryos after antagomir knockdown of miR-126. (C) Volcano plot of DEGs identified by RNA sequencing of 3 dpi embryos after antagomir knockdown of miR-126 and infection with M. marinum. Up-regulated neurobiology genes and down-regulated notch pathway genes are annotated. (D) Enrichment score mapping to the terms neuroactive ligand receptor interaction and Notch signalling pathway of DEGs identified by RNA sequencing of 3 dpf embryos after antagomir knockdown of miR-126 and infection with M. marinum.

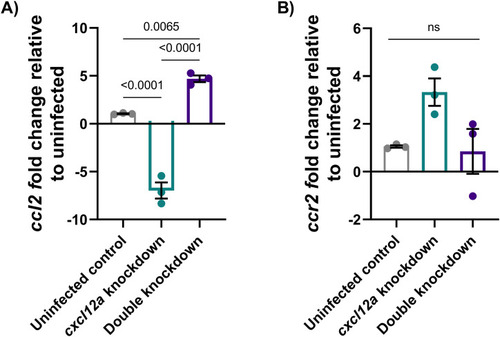
ccl2 but not ccr2 expression is dependent on cxcl12a.

(A, B) Expression of ccl2 as measured by RT-qPCR in uninfected (A) and M. marinum–infected cxcl12a and miR-126 knockdown embryos (B).

Acknowledgments
This image is the copyrighted work of the attributed author or publisher, and ZFIN has permission only to display this image to its users. Additional permissions should be obtained from the applicable author or publisher of the image. Full text @ Life Sci Alliance