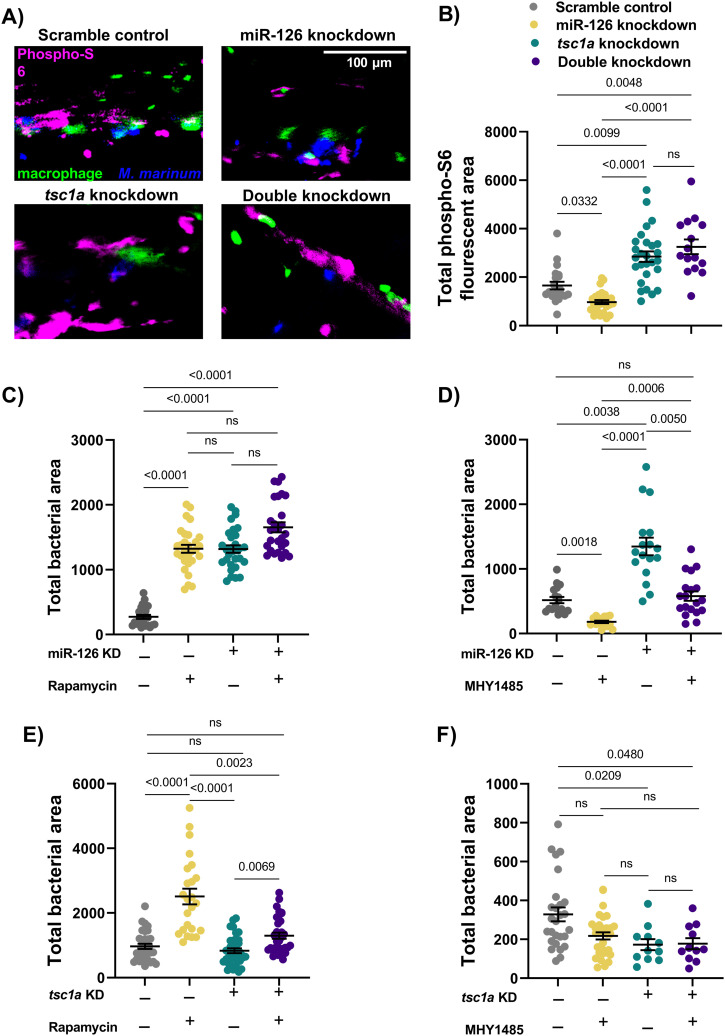
IMAGE

Figure 5.

ID
ZDB-IMAGE-240206-52
Source
Figures for Wright et al., 2024
Image
Figure Caption

Figure 5. miR-126 acts on tsc1a to influence mTOR signalling during infection.

(A) Representative images of phospho-S6 fluorescent staining in miR-126 and tsc1a knockdown embryos at 1 dpi. M. marinum is blue, macrophages are green, and phosphorylated ribosomal protein S6 is magenta. Scale bar represents 100 μm. (B) Phospho-S6 staining in M. marinum–infected scramble control, miR-126 knockdown, and tsc1a knockdown at 1 dpi. (C) miR-126 knockdown embryos were infected with M. marinum via caudal vein injection and treated with mTOR inhibitor rapamycin. Bacterial burden was analysed at 1 dpi. (D) miR-126 knockdown embryos were infected with M. marinum via caudal vein injection and treated with mTOR activator MHY1485. (E)tsc1a knockdown embryos were infected with M. marinum via caudal vein injection and treated with mTOR inhibitor rapamycin. Bacterial burden was analysed at 1 dpi. (F)tsc1a knockdown embryos were infected with M. marinum via caudal vein injection and treated with mTOR activator MHY1485. Bacterial burden was analysed at 1 dpi. Data information: each data point represents a single measurement (n = 11–36 embryos per group) with the mean and SEM shown. Phospho-S6 staining is a single experimental replicate, whereas rapamycin and MHY1485 treatments represent two experimental replicates each.

Acknowledgments
This image is the copyrighted work of the attributed author or publisher, and ZFIN has permission only to display this image to its users. Additional permissions should be obtained from the applicable author or publisher of the image. Full text @ Life Sci Alliance