IMAGE

Figure S1.

ID
ZDB-IMAGE-240206-47
Source
Figures for Wright et al., 2024
Image
Figure Caption

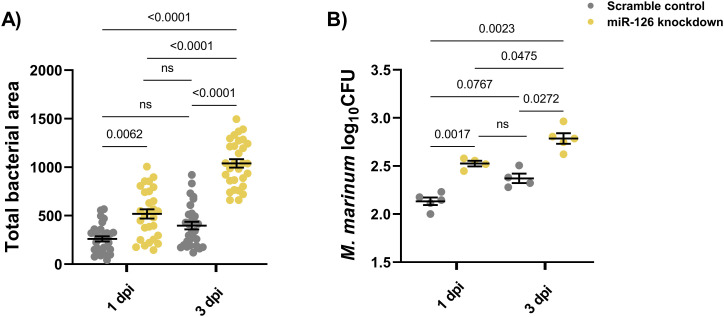
Figure S1. Comparison of infectious burden measurements in scramble control and miR-126 knockdown embryos at 1 and 3 dpi.

(A) Bacterial burden measured by fluorescent bacterial area method. (B) Bacterial recovery CFU measurement. For bacterial burden measurement, each data point represents a single embryo and comparisons calculated by a Kruskal–Wallis test. For CFU analysis, each data point represents five pooled embryos and comparisons calculated by one-way ANOVA. For both graphs, the mean and SEM are shown.

Acknowledgments
This image is the copyrighted work of the attributed author or publisher, and ZFIN has permission only to display this image to its users. Additional permissions should be obtained from the applicable author or publisher of the image. Full text @ Life Sci Alliance