IMAGE

Figure S2.

ID
ZDB-IMAGE-240206-49
Source
Figures for Wright et al., 2024
Image
Figure Caption

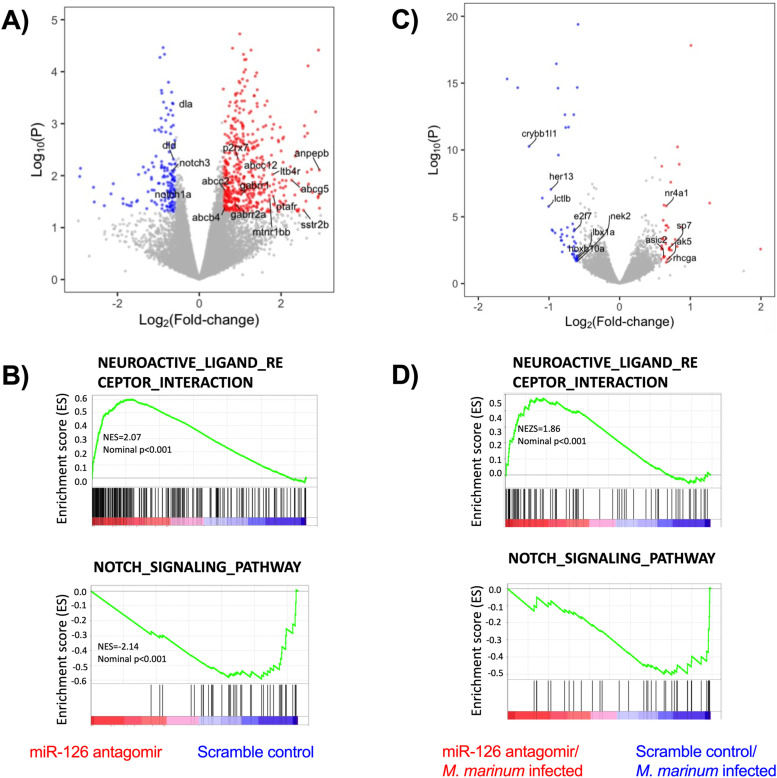
Figure S2. Modulation of miR-126 alters neural and notch signaling pathways.

(A) Volcano plot of differentially expressed genes (DEGs) identified by RNA sequencing of 3 dpi embryos after antagomir knockdown of miR-126. Up-regulated neurobiology genes and down-regulated notch pathway genes are annotated. (B) Enrichment score mapping to the terms neuroactive ligand receptor interaction and Notch signalling pathway of DEGs identified by RNA sequencing of 3 dpf embryos after antagomir knockdown of miR-126. (C) Volcano plot of DEGs identified by RNA sequencing of 3 dpi embryos after antagomir knockdown of miR-126 and infection with M. marinum. Up-regulated neurobiology genes and down-regulated notch pathway genes are annotated. (D) Enrichment score mapping to the terms neuroactive ligand receptor interaction and Notch signalling pathway of DEGs identified by RNA sequencing of 3 dpf embryos after antagomir knockdown of miR-126 and infection with M. marinum.

Acknowledgments
This image is the copyrighted work of the attributed author or publisher, and ZFIN has permission only to display this image to its users. Additional permissions should be obtained from the applicable author or publisher of the image. Full text @ Life Sci Alliance