IMAGE

Figure 2.

ID
ZDB-IMAGE-240206-48
Source
Figures for Wright et al., 2024
Image
Figure Caption

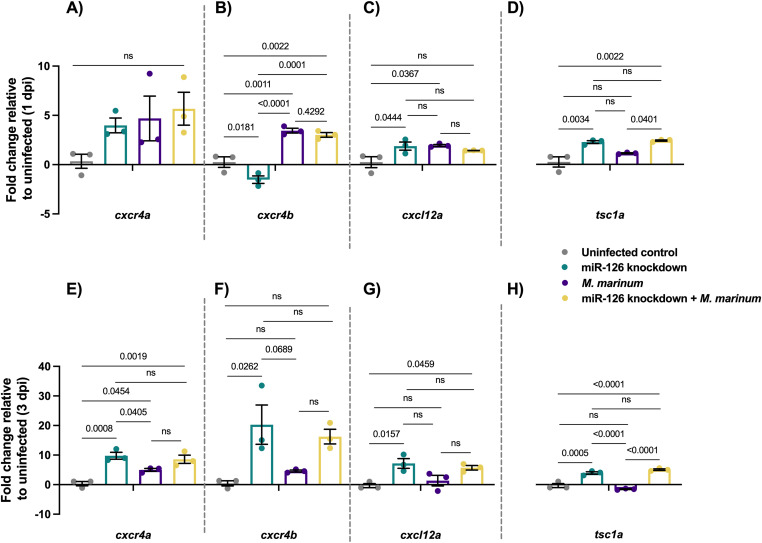
Figure 2. Expression of potential miR-126 mRNA targets is conserved in zebrafish M. marinum infection.

(A) Expression of cxcr4a at 1 dpi in miR-126 knockdown measured by RT-qPCR relative to uninfected scramble control embryos. (B) Expression of cxcr4b at 1 dpi in miR-126 knockdown measured by RT-qPCR relative to uninfected scramble control embryos. (C) Expression of cxcl12a at 1 dpi in miR-126 knockdown measured by RT-qPCR relative to uninfected scramble control embryos. (D) Expression of tsc1a at 1 dpi in miR-126 knockdown measured by RT-qPCR relative to uninfected scramble control embryos. (E) Expression of cxcr4a at 1 dpi in miR-126 knockdown measured by RT-qPCR relative to uninfected scramble control embryos. (F) Expression of cxcr4b at 1 dpi in miR-126 knockdown measured by RT-qPCR relative to uninfected scramble control embryos. (G) Expression of cxcl12a at 1 dpi in miR-126 knockdown measured by RT-qPCR relative to uninfected scramble control embryos. (H) Expression of tsc1a at 1 dpi in miR-126 knockdown measured by RT-qPCR relative to uninfected scramble control embryos. Data information: each data point represents a single measurement of 10 pooled embryos and two technical replicates, with the mean and SEM shown and comparisons calculated by one-way ANOVA.

Acknowledgments
This image is the copyrighted work of the attributed author or publisher, and ZFIN has permission only to display this image to its users. Additional permissions should be obtained from the applicable author or publisher of the image. Full text @ Life Sci Alliance