FIGURE

Figure 10.

ID
ZDB-FIG-240206-58
Publication
Wright et al., 2024 - Zebrafish tsc1 and cxcl12a increase susceptibility to mycobacterial infection
Other Figures
All Figure Page
Back to All Figure Page
Figure 10.

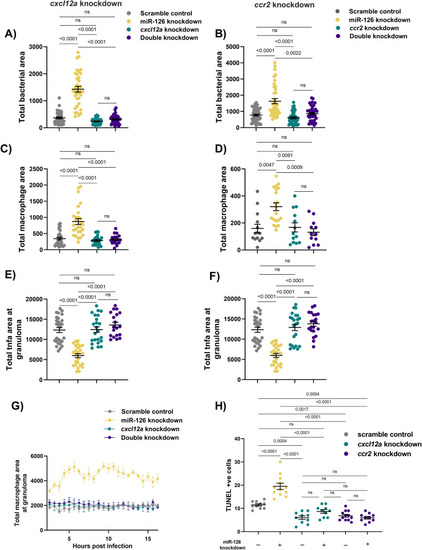
Infection-induced miR-126 regulates Cxcl12/Ccl2/Ccr2 signalling to restrict macrophage recruitment to sites of infection.

(A, B) Bacterial burden measured at 1 dpi in miR-126 and cxcl12a (A) or ccr2 (B) knockdown embryos infected with M. marinum. (C, D) Whole-body macrophage levels measured at 1 dpi in miR-126 and cxcl12a (C) or ccr2 (D) knockdown embryos infected with M. marinum. (E, F)tnfa fluorescent area at sites of infection measured at 1 dpi in miR-126 and cxcl12a (E) and ccr2 (F) knockdown embryos infected with M. marinum. (G) Measurement of macrophage levels after trunk infection with M. marinum in miR-126 knockdown and cxcl12a embryos. (H) TUNEL +ve cells counted at 3 dpi in miR-126 and cxcl12a or ccr2 knockdown embryos infected with M. marinum. Data information: each data point represents a single measurement, with the mean and SEM shown (n = 10–45) embryos per group. Bacterial burden, macrophage analysis, and granuloma tnfa graphs are representative of two experimental replicates, whereas TUNEL staining is presented as a single replicate. For macrophage time-lapse imaging, each data point represents the mean of three foci of infection from three separate embryos.

Expression Data

Expression Detail
Antibody Labeling
Phenotype Data

Phenotype Detail
Acknowledgments
This image is the copyrighted work of the attributed author or publisher, and ZFIN has permission only to display this image to its users. Additional permissions should be obtained from the applicable author or publisher of the image. Full text @ Life Sci Alliance