
- Title
-
Poly(I:C)-exposed zebrafish shows autism-like behaviors which are ameliorated by fabp2 gene knockout
- Authors
- Wu, J., Lin, X., Wu, D., Yan, B., Bao, M., Zheng, P., Wang, J., Yang, C., Li, Z., Jin, X., Jiang, K.
- Source
- Full text @ Front. Mol. Neurosci.
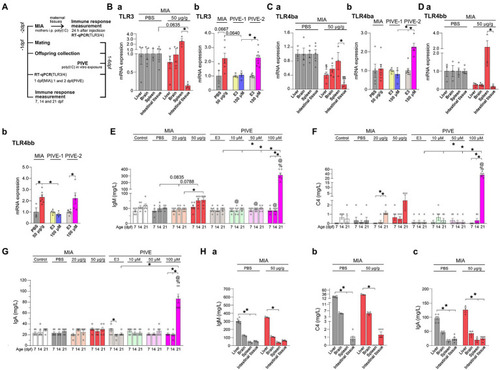
MIA offspring born to mothers injected with poly(I:C) showed an immune response. (A) For the maternal immune response induced by poly(I:C) (MIA-50 μg/g), 24 h after injection, TLR3, TLR4ba, and TLR4bb genes were selected and detected by quantitative RT-PCR, and the immunoglobulin M (IgM), complement C4 (C4) and immunoglobulin A (IgA) levels were analyzed by the immunoturbdimetric assay method. For MIA offspring TLR3, TLR4ba, and TLR4bb gene levels and IgM, C4 and IgA levels were checked at 1 dpf; as well as for PIVE, TLR3, TLR4ba and TLR4bb gene levels and IgM, C4, and IgA levels were tested at 1 dpf (PIVE-1) or 2 dpf (PIVE-2) after a 24 h poly(I:C) treatment. (Ba) TLR3 mRNA expression was up-regulated in spleen of maternal fish of MIA-50 μg/g group (U = 0, p = 0.0635) compared to that of MIA-PBS group; TLR3 mRNA expression was significantly down-regulated in intestinal tissue compared to that in spleen of maternal fish of MIA-50 μg/g group (Z = 3.37, p < 0.05). (Bb) TLR3 mRNA expression was up-regulated of MIA offspring (U = 3.30, p = 0.0667) compared to that of MIA-PBS group; For PIVE, there was no significant change in TLR3 mRNA expression of the offspring collected at 1 dpf after a 24 h poly(I:C) treatment; while TLR3 mRNA expression of the offspring collected at 2 dpf after a 24 h poly(I:C) treatment was significantly up-regulated. (Ca) TLR4ba mRNA expression was significantly down-regulated in intestinal tissue and liver of maternal fish of MIA-50 μg/g group compared to that of MIA-PBS group (Two-way ANOVA, F = 32.07 for MIA and F = 2.40 for Tissue; multiple comparisons test: t = 5.04 and 3.06, p < 0.01 and 0.05, in intestinal tissue and liver, respectively). TLR4ba mRNA expression was significantly down-regulated in intestinal tissue compared to that in spleen of maternal fish of MIA-50 μg/g group (t = 3.41, p < 0.05). (Cb) TLR4ba mRNA expression did not changed of MIA offspring compared to that of MIA-PBS group; For PIVE, there was no significant change in TLR4ba mRNA expression of the offspring collected at 1 dpf after a 24 h poly(I:C) treatment; while TLR4ba mRNA expression of the offspring collected at 2 dpf after a 24 h poly(I:C) treatment was significantly up-regulated (U = 0.00, p < 0.05). (Da) TLR4bb mRNA expression was significantly down-regulated in intestinal tissue compared to that in spleen of maternal fish of MIA-50 μg/g group (Z = 2.89, p < 0.05). (Db) TLR4bb mRNA expression was up-regulated of MIA offspring (U = 1.00, p < 0.05) compared to that of MIA-PBS group; For PIVE, there was no significant change in TLR4bb mRNA expression of the offspring collected at 1 dpf after a 24 h poly(I:C) treatment; while TLR4bb mRNA expression of the offspring collected at 2 dpf after a 24 h poly(I:C) treatment was significantly up-regulated (U = 1.00, p < 0.05). (E) The levels of IgM were increased of MIA-50 μg/g offspring at 14 dpf (Z = 2.46, p = 0.08, compared to that of MIA-PBS group). The levels of IgM were significantly increased of PIVE-100 μm larvae at 21 dpf (Z = 3.14, p < 0.05, compared to that of PIVE-E3 group). (F) The levels of C4 were not changed significantly of MIA-50 μg/g offspring. The levels of C4 were significantly increased of PIVE-100 μm larvae at 21 dpf (Z = 3.43, p < 0.05, compared to that of PIVE-E3 group). (G) The levels of IgA were not changed significantly of MIA-50 μg/g offspring. The levels of IgA were significantly increased of PIVE-100 μm larvae at 21 dpf (Z = 3.58, p < 0.05, compared to that of PIVE-E3 group). (Habc) IgM, C4 and IgA levels were not changed significantly of maternal fish of MIA-50 μg/g group compared to that of MIA-PBS group. Data are presented as mean ± SEM. *p < 0.05; $p < 0.05 compared with the MIA-PBS group of the same age; %p < 0.05 compared with the MIA-20 μg/g group of the same age; @p < 0.05 compared with the MIA-50 μg/g group of the same age. Detail about the n and descriptive data for each group and statistical analysis results could be found in Additional file 11: File S4. |
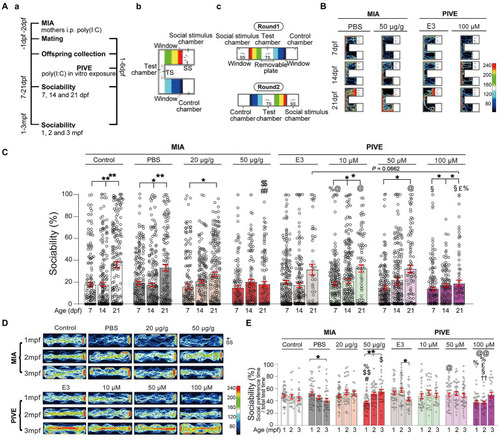
MIA offspring exhibited impaired social approach. (Aa) Zebrafish were tested for sociability (percentage of time spent investigating social object/total test time spent) at 7, 14, and 21 dpf (Ab), and 1, 2, and 3 mpf (Ac) after maternal poly(I:C) injection (MIA) or PIVE to fertilized embryos. (B) Video tracking of movements of MIA and PIVE larvae at 7, 14, and 21 dpf, showing the social interaction with social cue. (C) Sociability of MIA and PIVE larvae at 7, 14, and 21 dpf. MIA impaired the sociability at 21 dpf in 50 μg/g group ( |
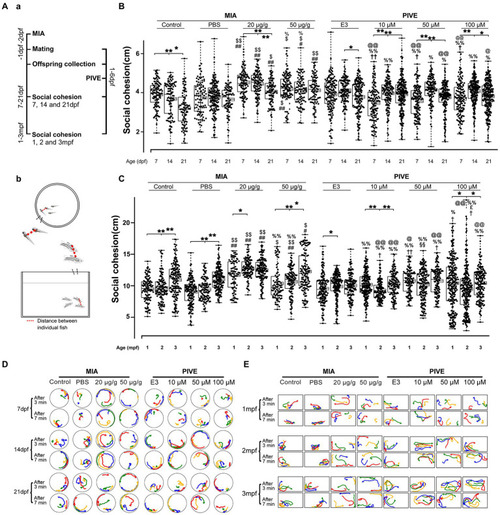
MIA offspring exhibited decreased social cohesion. (Aa) Zebrafish were tested for social cohesion (distance between individual fish) at 7, 14, and 21 dpf, and 1, 2, and 3 mpf (Ab) after maternal poly(I:C) injection (MIA) or PIVE to fertilized embryos. |
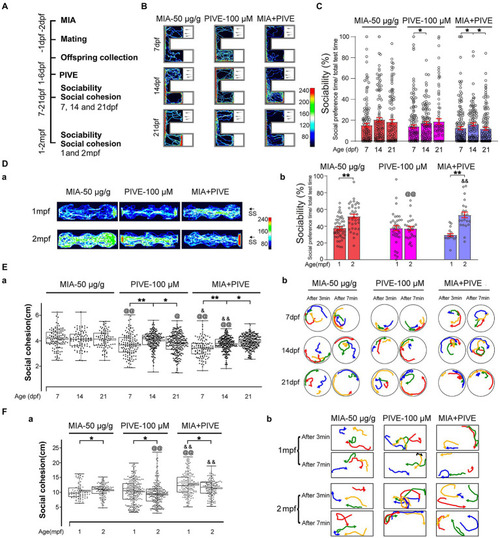
MIA combined with PIVE impaired social approach and decreased social cohesion. (A) Zebrafish were tested for sociability and social cohesion at 7, 14, and 21 dpf, and 1 and 2 mpf after MIA + PIVE. (B) Video tracking of movements of MIA + PIVE larvae at 7, 14, and 21 dpf, showing the social interaction with the social cue. (C) Sociability of MIA + PIVE larvae at 7, 14, and 21 dpf. MIA + PIVE did not further impair the sociability at 7, 14, and 21 dpf. (Da) Video tracking of movements of MIA + PIVE fish at 1 and 2 mpf, showing the social interaction with the social cue. (Db) Sociability of MIA + PIVE fish at 1 and 2 mpf. Although the sociability in the MIA + PIVE group decreased at 1 mpf, but not statistically significant. (Ea,Fa) MIA + PIVE induced an increased social cohesion at 7 and14 dpf (Z = 4.73, 4.32, and 3.16, p < 0.01, 0.01 and 0.05, respectively, for 7, 14, and 21 dpf vs. MIA-50 μg/g; Z = 2.55 and 5.55, p < 0.05 and 0.01, respectively, for 7 and 14 dpf vs. PIVE-100 μM), and a decreased social cohesion at 1 and 2 mpf (Z = 4.61, p < 0.01 for 1 mpf vs. MIA-50 μg/g; Z = 5.40 and 6.89, p all <0.01 for 1 and 2 mpf vs. PIVE-100 μM). (Eb,Fb) Tracking of individual fish in a group of four fish show impaired social cohesion in MIA + PIVE fish. Data are presented as mean ± SEM. *p < 0.05, **p < 0.001; @p < 0.05, @@p < 0.001 compared with the MIA-50 μg/g group of the same age. &p < 0.05, &&p < 0.001 compared with the PIVE-100 μM group of the same age. Detail about the n and descriptive data for each group and statistical analysis results could be found in Additional file 11: File S4. |
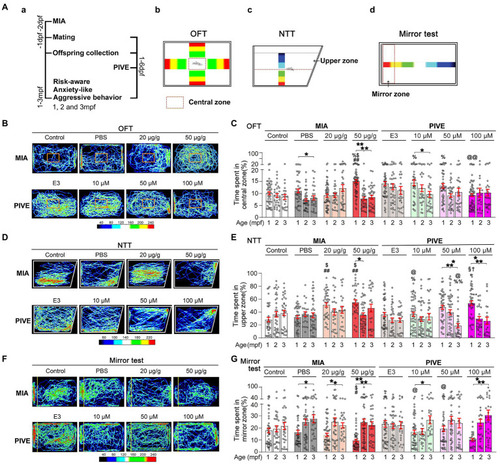
MIA offspring exhibited a decreased risk-aware, anxiety-like and aggressive behavior. (Aa) OFT (Ab), NNT (Ac), and mirror (Ad) tests were used to evaluate the risk-awareness, anxiety-like and aggressive behavior at 1, 2, and 3 mpf of MIA or PIVE fish. (B) Video tracking of movements of MIA or PIVE fish during OFT. (C) Only MIA-50 μg/g exhibited a decreased risk-awareness at 1 mpf (MIA-50 μg/g: Z = 4.41 and 3.48, p < 0.01 and 0.05 vs. MIA-Control and MIA-PBS respectively), as they spent more time in the central zone of the tank. (D) Video tracking of movements of MIA or PIVE fish during NNT. (E) MIA-20 and 50 μg/g exhibited a decreased anxiety-like behavior at 1 mpf as they spent more time in upper zone of the tank (MIA-20 μg/g: Z = 4.17 and 3.46, p < 0.01 and < 0.05 vs. MIA-Control and MIA-PBS, respectively. MIA-50 μg/g: Z = 4.45 and 3.77, p < 0.01 and < 0.05 vs. MIA-Control and MIA-PBS, respectively); as well as observed at 1 mpf in PIVE-100 μM group (Z = 3.21, p < 0.05 vs. PIVE-E3 group). (F) Video tracking of movements of MIA or PIVE fish during mirror test. (G) MIA-50 μg/g exhibited a decreased aggressive behavior at 1 mpf as they spent less time in mirror zone of the tank during mirror test (Z = 3.17 and 2.96, p all <0.05 vs. MIA-Control and MIA-PBS respectively); similar change was not observed in PIVE-100 μM group. Data are presented as mean ± SEM. *p < 0.05, **p < 0.001; #p < 0.05, ##p < 0.001 compared with the MIA-control group of the same age with social stimulus; $p < 0.05 compared with the MIA-PBS group of the same age with social stimulus; %p < 0.05, %%p < 0.001 compared with the MIA-20 μg/g group of the same age; @p < 0.05, @@p < 0.001 compared with the MIA-50 μg/g group of the same age.†p < 0.05 compared with the PIVE-E3 group of the same age with social stimulus. §p < 0.05 compared with the PIVE-10 μM group of the same age. Detail about the n and descriptive data for each group and statistical analysis results could be found in Additional file 11: File S4. |
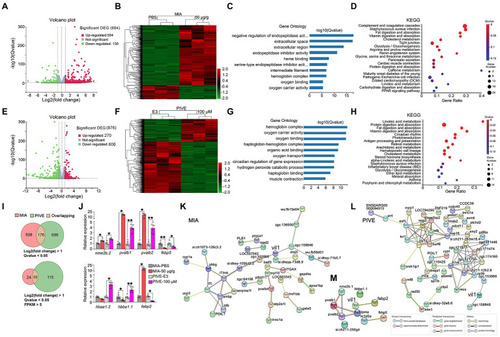
Clustering, GO enrichment and KEGG signaling pathway analysis of DEGs. (A) A volcano graph shows DEGs in MIA-50 μg/g zebrafish brain. The red dots indicate up-regulated genes and the green dots indicate down-regulated genes. (B) The overall distribution of DEGs between the MIA-50 μg/g group and MIA-PBS group at 1 mpf. Red and green represent up-regulated and down-regulated changes, respectively, in the clustering analysis. The color intensity is directly proportional to the levels of changes. (C) GO analysis of MIA-induced DEGs; bar plot shows the top 10 enrichment score [−log10 (Q-value)] of DEGs involving biological process, cellular component, and molecular function. (D) Significant changes in the KEGG pathway of MIA-induced DEGs. The bubble graph shows enrichment score [−log10 (Q-value)] of the significant pathway. The size of the circle represents the number of enriched DEGs. Q-value is represented by a color scale, and the statistical significance increases from blue (relatively lower significance) to red (relatively higher significance). (E) A volcano graph shows DEGs in PIVE-100 μM zebrafish brain. (F) The overall distribution of DEGs in the PIVE-100 μM group and PIVE-E3 group at 1 mpf. (G) A GO analysis of PIVE-induced DEGs. (H) Significant changes in the KEGG pathway of MIA-induced DEGs. (I) Venn diagram denoting the number of all DEGs by two thresholds that are affected in MIA or PIVE offspring. (J) Quantitative RT-PCR validation of top 7 co-expressed differential gens in brain of MIA-50 μg/g and PIVE-100 μM group at 1 mpf [MIA-50 μg/g: t = 4.33, 25.00(U), 25.00(U), 1.78, 2.50 and 25.00(U), p < 0.05, 0.05, 0.05, 0.01, 0.05, and 0.05 for nme2b.2, pvalb1, pvalb2, fkbp5, hbbe1.1, and fabp2, respectively, vs. MIA-PBS. PIVE-100 μM: t = 4.18, 7.63, 5.62, 3.04, 25.00(U), 5.13 and 25.00(U), p < 0.05, 0.01, 0.01, 0.05, 0.05, 0.01, and 0.05 for nme2b.2, pvalb1, pvalb2, fkbp5, hbbe1.2, hbbe1.1, and fabp2, respectively, vs. PIVE-E3.]. PPI network of DEGs of MIA-50 μg/g group (K) and PIVE-100 μM group (L). (M) PPI network of fabp2. Nodes represent genes, lines represent the interaction of proteins with genes, and the results within the nodes represent the structure of proteins. Line colors represent evidence of interactions between proteins. Data are presented as mean ± SEM. *p < 0.05, **p < 0.001. Detail about the n and descriptive data for each group and statistical analysis results could be found in Additional file 11: File S4. |
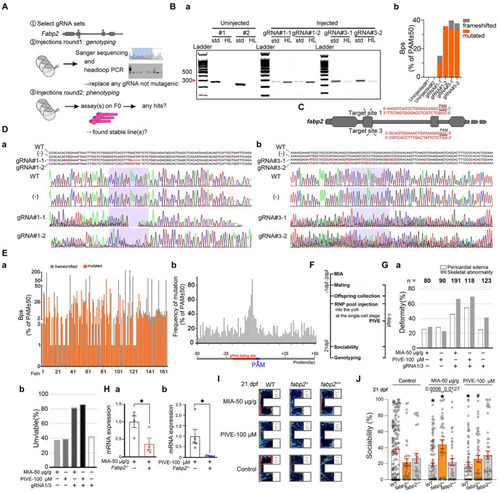
Fabp2 gene F0 knockout ameliorated MIA-induced autism-like behaviors. (A) Two rounds F0 knockout of fabp2 gene including selection of gRNAs, verification of mutagenic gRNAs and phenotyping. (Ba) Target loci of fabp2 amplified with the PCR primes used for sequencing (std, standard) or with headloop primer (HL). (Bb) Frameshifted and mutated bps (Sanger sequencing) of the same samples as showed in (Ba). (C) Schematic diagram of the target site in the zebrafish fabp2 genome. (Dab) Sequencing maps of WT and fabp2−/− zebrafish. (−): gRNA not mutagenic. (Ea) Frameshifted and mutated bps (Sanger sequencing) of all samples (83 fish at 21 dpf; 46 fish at 1 mpf which for finding stable lines). (Eb) Frequency of mutations of R50-PAM-F50 (83 fish at 21 dpf; 46 fish at 1 mpf which for finding stable lines). (F) After maternal poly(I:C) injection (MIA), two-RNP pool was injected into the yolk at the single-cell stage before cell inflation; or two-RNP pool was injected into the yolk at the single-cell stage followed by PIVE to these embryos, and zebrafish were tested for sociability at 21 dpf followed by verification of genotyping. (Ga) Deformity of gRNA injection with MIA or PIVE. (Gb) Unviability of gRNA injection with MIA or PIVE. (Hab) mRNA expressions of |