
Figure 1
- ID
- ZDB-FIG-230124-59
- Publication
- Wu et al., 2023 - Poly(I:C)-exposed zebrafish shows autism-like behaviors which are ameliorated by fabp2 gene knockout
- Other Figures
- All Figure Page
- Back to All Figure Page
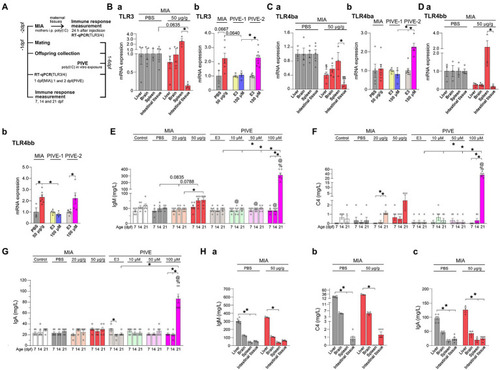
MIA offspring born to mothers injected with poly(I:C) showed an immune response. (A) For the maternal immune response induced by poly(I:C) (MIA-50 μg/g), 24 h after injection, TLR3, TLR4ba, and TLR4bb genes were selected and detected by quantitative RT-PCR, and the immunoglobulin M (IgM), complement C4 (C4) and immunoglobulin A (IgA) levels were analyzed by the immunoturbdimetric assay method. For MIA offspring TLR3, TLR4ba, and TLR4bb gene levels and IgM, C4 and IgA levels were checked at 1 dpf; as well as for PIVE, TLR3, TLR4ba and TLR4bb gene levels and IgM, C4, and IgA levels were tested at 1 dpf (PIVE-1) or 2 dpf (PIVE-2) after a 24 h poly(I:C) treatment. (Ba) TLR3 mRNA expression was up-regulated in spleen of maternal fish of MIA-50 μg/g group (U = 0, p = 0.0635) compared to that of MIA-PBS group; TLR3 mRNA expression was significantly down-regulated in intestinal tissue compared to that in spleen of maternal fish of MIA-50 μg/g group (Z = 3.37, p < 0.05). (Bb) TLR3 mRNA expression was up-regulated of MIA offspring (U = 3.30, p = 0.0667) compared to that of MIA-PBS group; For PIVE, there was no significant change in TLR3 mRNA expression of the offspring collected at 1 dpf after a 24 h poly(I:C) treatment; while TLR3 mRNA expression of the offspring collected at 2 dpf after a 24 h poly(I:C) treatment was significantly up-regulated. (Ca) TLR4ba mRNA expression was significantly down-regulated in intestinal tissue and liver of maternal fish of MIA-50 μg/g group compared to that of MIA-PBS group (Two-way ANOVA, F = 32.07 for MIA and F = 2.40 for Tissue; multiple comparisons test: t = 5.04 and 3.06, p < 0.01 and 0.05, in intestinal tissue and liver, respectively). TLR4ba mRNA expression was significantly down-regulated in intestinal tissue compared to that in spleen of maternal fish of MIA-50 μg/g group (t = 3.41, p < 0.05). (Cb) TLR4ba mRNA expression did not changed of MIA offspring compared to that of MIA-PBS group; For PIVE, there was no significant change in TLR4ba mRNA expression of the offspring collected at 1 dpf after a 24 h poly(I:C) treatment; while TLR4ba mRNA expression of the offspring collected at 2 dpf after a 24 h poly(I:C) treatment was significantly up-regulated (U = 0.00, p < 0.05). (Da) TLR4bb mRNA expression was significantly down-regulated in intestinal tissue compared to that in spleen of maternal fish of MIA-50 μg/g group (Z = 2.89, p < 0.05). (Db) TLR4bb mRNA expression was up-regulated of MIA offspring (U = 1.00, p < 0.05) compared to that of MIA-PBS group; For PIVE, there was no significant change in TLR4bb mRNA expression of the offspring collected at 1 dpf after a 24 h poly(I:C) treatment; while TLR4bb mRNA expression of the offspring collected at 2 dpf after a 24 h poly(I:C) treatment was significantly up-regulated (U = 1.00, p < 0.05). (E) The levels of IgM were increased of MIA-50 μg/g offspring at 14 dpf (Z = 2.46, p = 0.08, compared to that of MIA-PBS group). The levels of IgM were significantly increased of PIVE-100 μm larvae at 21 dpf (Z = 3.14, p < 0.05, compared to that of PIVE-E3 group). (F) The levels of C4 were not changed significantly of MIA-50 μg/g offspring. The levels of C4 were significantly increased of PIVE-100 μm larvae at 21 dpf (Z = 3.43, p < 0.05, compared to that of PIVE-E3 group). (G) The levels of IgA were not changed significantly of MIA-50 μg/g offspring. The levels of IgA were significantly increased of PIVE-100 μm larvae at 21 dpf (Z = 3.58, p < 0.05, compared to that of PIVE-E3 group). (Habc) IgM, C4 and IgA levels were not changed significantly of maternal fish of MIA-50 μg/g group compared to that of MIA-PBS group. Data are presented as mean ± SEM. *p < 0.05; $p < 0.05 compared with the MIA-PBS group of the same age; %p < 0.05 compared with the MIA-20 μg/g group of the same age; @p < 0.05 compared with the MIA-50 μg/g group of the same age. Detail about the n and descriptive data for each group and statistical analysis results could be found in Additional file 11: File S4. |