FIGURE

Figure 2

ID
ZDB-FIG-230124-60
Publication
Wu et al., 2023 - Poly(I:C)-exposed zebrafish shows autism-like behaviors which are ameliorated by fabp2 gene knockout
Other Figures
All Figure Page
Back to All Figure Page
Figure 2

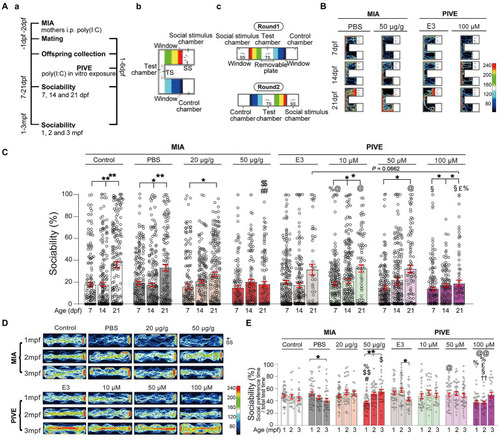
MIA offspring exhibited impaired social approach. (Aa) Zebrafish were tested for sociability (percentage of time spent investigating social object/total test time spent) at 7, 14, and 21 dpf (Ab), and 1, 2, and 3 mpf (Ac) after maternal poly(I:C) injection (MIA) or PIVE to fertilized embryos. (B) Video tracking of movements of MIA and PIVE larvae at 7, 14, and 21 dpf, showing the social interaction with social cue. (C) Sociability of MIA and PIVE larvae at 7, 14, and 21 dpf. MIA impaired the sociability at 21 dpf in 50 μg/g group (Z = 4.16 and 4.06, p < 0.01, compared to that of MIA-Control and MIA-PBS group, respectively); PIVE impaired the sociability at 21 dpf of 100 μM group (Z = 2.54, p = 0.07, compared to that of PIVE-E3 group). (D) Video tracking of movements of MIA and PIVE larvae at 1, 2, and 3 mpf, showing the social interaction with social cue. (E) Sociability of MIA and PIVE larvae at 1, 2, and 3 mpf. MIA decreased the sociability levels at 1 mpf of 50 μg/g group (Z = 3.59 and 3.99, p < 0.05 and 0.01, compared to that of MIA-Control and MIA-PBS group respectively); PIVE impaired the sociability at 2 mpf of 100 μM group (Z = 3.74, p < 0.01, compared to that of PIVE-E3 group). Data are presented as mean ± SEM. *p < 0.05, **p < 0.001; #p < 0.05, ##p < 0.001 compared with the MIA-control group of the same age with social stimulus; $p < 0.05, $$p < 0.001 compared with the MIA-PBS group of the same age with social stimulus; %p < 0.05 compared with the MIA-20 μg/g group of the same age; @p < 0.05, @@p < 0.001 compared with the MIA-50 μg/g group of the same age. ††p < 0.001 compared with the PIVE-E3 group of the same age with social stimulus. §p < 0.05 compared with the PIVE-10 μM group of the same age; £p < 0.05 compared with the PIVE-50 μM group of the same age. TS, Test subject; SS, Social stimulus. Detail about the n and descriptive data for each group and statistical analysis results could be found in Additional file 11: File S4.

Expression Data

Expression Detail
Antibody Labeling
Phenotype Data

Phenotype Detail
Acknowledgments
This image is the copyrighted work of the attributed author or publisher, and ZFIN has permission only to display this image to its users. Additional permissions should be obtained from the applicable author or publisher of the image. Full text @ Front. Mol. Neurosci.