Figure Caption
Figure 3
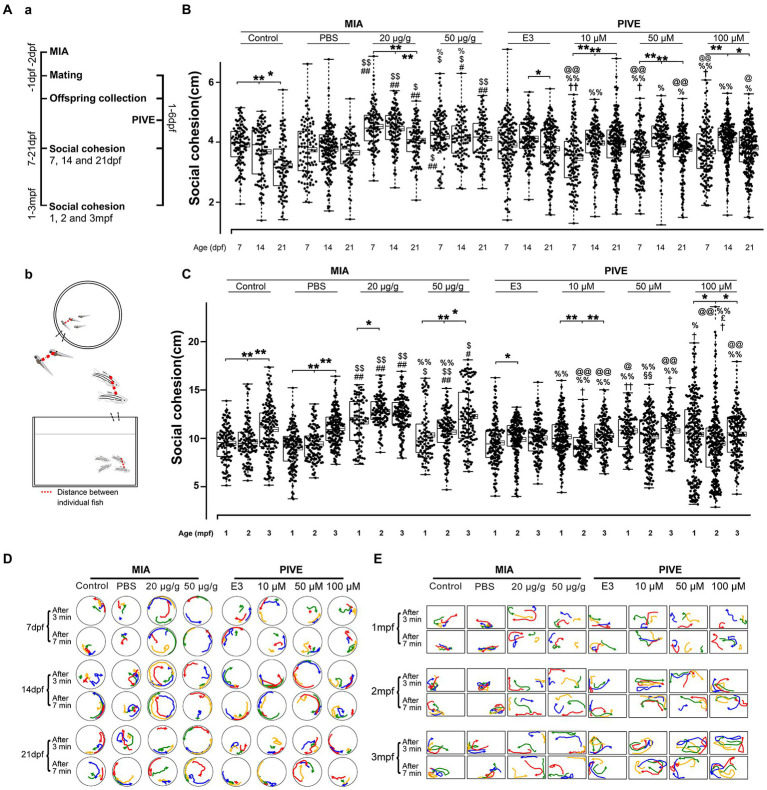
MIA offspring exhibited decreased social cohesion. (Aa) Zebrafish were tested for social cohesion (distance between individual fish) at 7, 14, and 21 dpf, and 1, 2, and 3 mpf (Ab) after maternal poly(I:C) injection (MIA) or PIVE to fertilized embryos. (B) Both MIA-20 and 50 μg/g induced a decreased social cohesion at 7, 14, and 21 dpf (MIA-20 μg/g: Z = 5.66, 6.31, and 5.57, p all <0.01 for 7, 14, and 21 dpf vs. MIA-Control; Z = 6.66, 7.45, and 3.59, p < 0.01, 0.01, and 0.05, respectively, for 7, 14, and 21 dpf vs. MIA-PBS. MIA-50 μg/g: Z = 2.54, 2.68 and 5.95, p = 0.07, <0.05 and 0.01, respectively, for 7, 14, and 21 dpf vs. MIA-Control; Z = 3.69, 3.30, and 4.01, p < 0.05, 0.05, and 0.01, respectively, for 7, 14, and 21 dpf vs. MIA-PBS) but not for PIVE fish. (C) Both MIA-20 and 50 μg/g induced a decreased social cohesion at 1, 2, and 3 mpf (MIA-20 μg/g: Z = 5.76, 10.93, and 7.72, p all <0.01 for 1, 2, and 3 mpf vs. MIA-Control; Z = Z = 7.46, 11.63, and 5.77, p all <0.01 for 1, 2 and 3 mpf vs. MIA-PBS. MIA-50 μg/g: Z = 1.60, 4.06 and 3.48, p > 0.05, <0.01 and 0.05, respectively, for 1, 2, and 3 mpf vs. MIA-Control; Z = 3.15, 4.85, and 3.51, p < 0.05, 0.01, and 0.05, respectively, for 7, 14, and 21 dpf vs. MIA-PBS), but not for PIVE fish. (D,E) Tracking of individual fish in a group of four fish shows impaired social cohesion in MIA fish. The movement of each group of fish was analyzed after video tracking. The positions of individual fish in 3 s periods at two different time windows (3 and 7 min, respectively) were traced, and their paths were presented in different colors (#1 fish in red, #2 fish in yellow, and so on). Aggregation of MIA-control/PBS and PIVE-E3 fish groups in a corner of tank is apparent, in comparison with MIA fish. Data are presented as mean ± SEM (right side of the histogram), median ± 75% confidence interval (left side of the histogram), and maximum and minimum. *p < 0.05, **p < 0.001; #p < 0.05, ##p < 0.001 compared with the MIA-control group of the same age with social stimulus; $p < 0.05, $$p < 0.001 compared with the MIA-PBS group of the same age with social stimulus; %p < 0.05, %%p < 0.001 compared with the MIA-20 μg/g group of the same age; @p < 0.05, @@p < 0.001 compared with the MIA-50 μg/g group of the same age.†p < 0.05, ††p < 0.001 compared with the PIVE-E3 group of the same age with social stimulus. §§p < 0.001 compared with the PIVE-10 μM group of the same age; £p < 0.05 compared with the PIVE-50 μM group of the same age. Detail about the n and descriptive data for each group and statistical analysis results could be found in Additional file 11: File S4.
Acknowledgments
This image is the copyrighted work of the attributed author or publisher, and
ZFIN has permission only to display this image to its users.
Additional permissions should be obtained from the applicable author or publisher of the image.
Full text @ Front. Mol. Neurosci.