
Figure 5
- ID
- ZDB-FIG-230124-64
- Publication
- Wu et al., 2023 - Poly(I:C)-exposed zebrafish shows autism-like behaviors which are ameliorated by fabp2 gene knockout
- Other Figures
- All Figure Page
- Back to All Figure Page
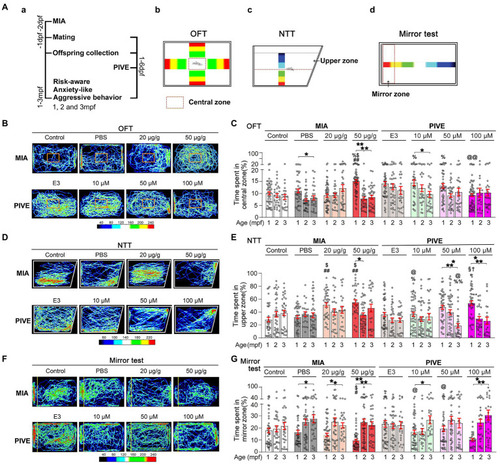
MIA offspring exhibited a decreased risk-aware, anxiety-like and aggressive behavior. (Aa) OFT (Ab), NNT (Ac), and mirror (Ad) tests were used to evaluate the risk-awareness, anxiety-like and aggressive behavior at 1, 2, and 3 mpf of MIA or PIVE fish. (B) Video tracking of movements of MIA or PIVE fish during OFT. (C) Only MIA-50 μg/g exhibited a decreased risk-awareness at 1 mpf (MIA-50 μg/g: Z = 4.41 and 3.48, p < 0.01 and 0.05 vs. MIA-Control and MIA-PBS respectively), as they spent more time in the central zone of the tank. (D) Video tracking of movements of MIA or PIVE fish during NNT. (E) MIA-20 and 50 μg/g exhibited a decreased anxiety-like behavior at 1 mpf as they spent more time in upper zone of the tank (MIA-20 μg/g: Z = 4.17 and 3.46, p < 0.01 and < 0.05 vs. MIA-Control and MIA-PBS, respectively. MIA-50 μg/g: Z = 4.45 and 3.77, p < 0.01 and < 0.05 vs. MIA-Control and MIA-PBS, respectively); as well as observed at 1 mpf in PIVE-100 μM group (Z = 3.21, p < 0.05 vs. PIVE-E3 group). (F) Video tracking of movements of MIA or PIVE fish during mirror test. (G) MIA-50 μg/g exhibited a decreased aggressive behavior at 1 mpf as they spent less time in mirror zone of the tank during mirror test (Z = 3.17 and 2.96, p all <0.05 vs. MIA-Control and MIA-PBS respectively); similar change was not observed in PIVE-100 μM group. Data are presented as mean ± SEM. *p < 0.05, **p < 0.001; #p < 0.05, ##p < 0.001 compared with the MIA-control group of the same age with social stimulus; $p < 0.05 compared with the MIA-PBS group of the same age with social stimulus; %p < 0.05, %%p < 0.001 compared with the MIA-20 μg/g group of the same age; @p < 0.05, @@p < 0.001 compared with the MIA-50 μg/g group of the same age.†p < 0.05 compared with the PIVE-E3 group of the same age with social stimulus. §p < 0.05 compared with the PIVE-10 μM group of the same age. Detail about the n and descriptive data for each group and statistical analysis results could be found in Additional file 11: File S4. |