
|
Figure 6
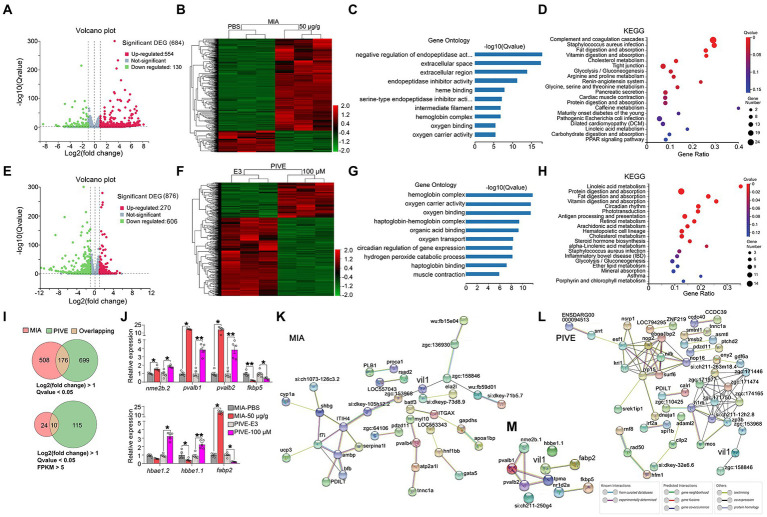
Clustering, GO enrichment and KEGG signaling pathway analysis of DEGs. (A) A volcano graph shows DEGs in MIA-50 μg/g zebrafish brain. The red dots indicate up-regulated genes and the green dots indicate down-regulated genes. (B) The overall distribution of DEGs between the MIA-50 μg/g group and MIA-PBS group at 1 mpf. Red and green represent up-regulated and down-regulated changes, respectively, in the clustering analysis. The color intensity is directly proportional to the levels of changes. (C) GO analysis of MIA-induced DEGs; bar plot shows the top 10 enrichment score [−log10 (Q-value)] of DEGs involving biological process, cellular component, and molecular function. (D) Significant changes in the KEGG pathway of MIA-induced DEGs. The bubble graph shows enrichment score [−log10 (Q-value)] of the significant pathway. The size of the circle represents the number of enriched DEGs. Q-value is represented by a color scale, and the statistical significance increases from blue (relatively lower significance) to red (relatively higher significance). (E) A volcano graph shows DEGs in PIVE-100 μM zebrafish brain. (F) The overall distribution of DEGs in the PIVE-100 μM group and PIVE-E3 group at 1 mpf. (G) A GO analysis of PIVE-induced DEGs. (H) Significant changes in the KEGG pathway of MIA-induced DEGs. (I) Venn diagram denoting the number of all DEGs by two thresholds that are affected in MIA or PIVE offspring. (J) Quantitative RT-PCR validation of top 7 co-expressed differential gens in brain of MIA-50 μg/g and PIVE-100 μM group at 1 mpf [MIA-50 μg/g: t = 4.33, 25.00(U), 25.00(U), 1.78, 2.50 and 25.00(U), p < 0.05, 0.05, 0.05, 0.01, 0.05, and 0.05 for nme2b.2, pvalb1, pvalb2, fkbp5, hbbe1.1, and fabp2, respectively, vs. MIA-PBS. PIVE-100 μM: t = 4.18, 7.63, 5.62, 3.04, 25.00(U), 5.13 and 25.00(U), p < 0.05, 0.01, 0.01, 0.05, 0.05, 0.01, and 0.05 for nme2b.2, pvalb1, pvalb2, fkbp5, hbbe1.2, hbbe1.1, and fabp2, respectively, vs. PIVE-E3.]. PPI network of DEGs of MIA-50 μg/g group (K) and PIVE-100 μM group (L). (M) PPI network of fabp2. Nodes represent genes, lines represent the interaction of proteins with genes, and the results within the nodes represent the structure of proteins. Line colors represent evidence of interactions between proteins. Data are presented as mean ± SEM. *p < 0.05, **p < 0.001. Detail about the n and descriptive data for each group and statistical analysis results could be found in Additional file 11: File S4.