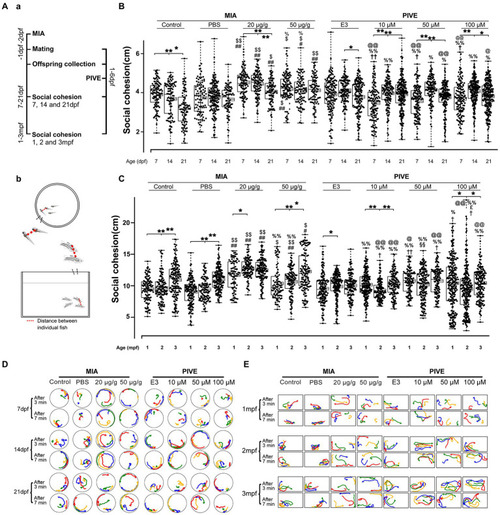
MIA offspring exhibited decreased social cohesion. (Aa) Zebrafish were tested for social cohesion (distance between individual fish) at 7, 14, and 21 dpf, and 1, 2, and 3 mpf (Ab) after maternal poly(I:C) injection (MIA) or PIVE to fertilized embryos. (B) Both MIA-20 and 50 μg/g induced a decreased social cohesion at 7, 14, and 21 dpf (MIA-20 μg/g: Z = 5.66, 6.31, and 5.57, p all <0.01 for 7, 14, and 21 dpf vs. MIA-Control; Z = 6.66, 7.45, and 3.59, p < 0.01, 0.01, and 0.05, respectively, for 7, 14, and 21 dpf vs. MIA-PBS. MIA-50 μg/g: Z = 2.54, 2.68 and 5.95, p = 0.07, <0.05 and 0.01, respectively, for 7, 14, and 21 dpf vs. MIA-Control; Z = 3.69, 3.30, and 4.01, p < 0.05, 0.05, and 0.01, respectively, for 7, 14, and 21 dpf vs. MIA-PBS) but not for PIVE fish. (C) Both MIA-20 and 50 μg/g induced a decreased social cohesion at 1, 2, and 3 mpf (MIA-20 μg/g: Z = 5.76, 10.93, and 7.72, p all <0.01 for 1, 2, and 3 mpf vs. MIA-Control; Z = Z = 7.46, 11.63, and 5.77, p all <0.01 for 1, 2 and 3 mpf vs. MIA-PBS. MIA-50 μg/g: Z = 1.60, 4.06 and 3.48, p > 0.05, <0.01 and 0.05, respectively, for 1, 2, and 3 mpf vs. MIA-Control; Z = 3.15, 4.85, and 3.51, p < 0.05, 0.01, and 0.05, respectively, for 7, 14, and 21 dpf vs. MIA-PBS), but not for PIVE fish. (D,E) Tracking of individual fish in a group of four fish shows impaired social cohesion in MIA fish. The movement of each group of fish was analyzed after video tracking. The positions of individual fish in 3 s periods at two different time windows (3 and 7 min, respectively) were traced, and their paths were presented in different colors (#1 fish in red, #2 fish in yellow, and so on). Aggregation of MIA-control/PBS and PIVE-E3 fish groups in a corner of tank is apparent, in comparison with MIA fish. Data are presented as mean ± SEM (right side of the histogram), median ± 75% confidence interval (left side of the histogram), and maximum and minimum. *p < 0.05, **p < 0.001; #p < 0.05, ##p < 0.001 compared with the MIA-control group of the same age with social stimulus; $p < 0.05, $$p < 0.001 compared with the MIA-PBS group of the same age with social stimulus; %p < 0.05, %%p < 0.001 compared with the MIA-20 μg/g group of the same age; @p < 0.05, @@p < 0.001 compared with the MIA-50 μg/g group of the same age.†p < 0.05, ††p < 0.001 compared with the PIVE-E3 group of the same age with social stimulus. §§p < 0.001 compared with the PIVE-10 μM group of the same age; £p < 0.05 compared with the PIVE-50 μM group of the same age. Detail about the n and descriptive data for each group and statistical analysis results could be found in Additional file 11: File S4.
|
