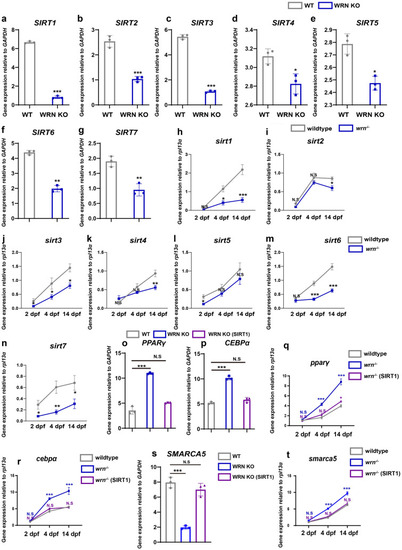
SIRT1 regulates SMARCA5 expression during adipogenesis in hMSCs and zebrafish models. a–g qRT-PCR analysis of SIRT family (SIRT1-7) on day 5 during adipogenesis (N = 3 biological replicates). h–n qRT-PCR analysis of sirt1-7 at 2 dpf, 4 dpf, and 14 dpf in zebrafish (N = 3 biological replicates). o, p qRT-PCR analysis of PPARγ (o) and CEBPα (p) among WT, WRN KO, and WRN KO (SIRT1) on day 5 during adipogenesis (N = 3 biological replicates). q, r qRT-PCR analysis of pparγ (q) and cebpα (r) among wildtype, wrn−/− mutant zebrafish, wrn−/− mutant zebrafish (SIRT1) (N = 3 biological replicates). s qRT-PCR analysis of SMARCA5 among WT, WRN KO, and WRN KO (SIRT1) on day 5 during adipogenesis (N = 3 biological replicates). t qRT-PCR analysis of smarca5 among wildtype, wrn−/− mutant zebrafish, wrn−/− mutant zebrafish (SIRT1) (N = 3 biological replicates). Data are presented as the mean ± S.D. Statistical analysis was performed using two-tailed unpaired Student’s t-test. *P < 0.05, **P < 0.01, ***P < 0.001
|
