|
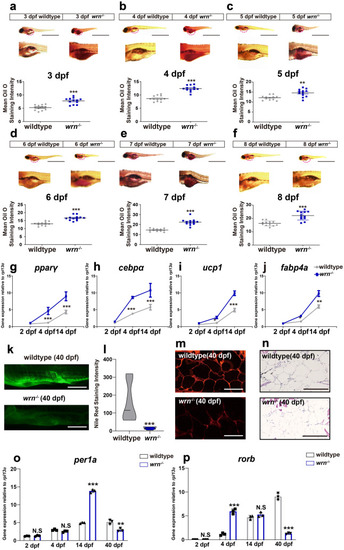
The wrn−/− mutant zebrafish shows adipocyte prematurity. a–f Representative images of Oil Red O staining from 3 dpf to 8 dpf (N = 3 biological replicates). Scale bar = 100 μm. g–j qRT-PCR analysis of selected adipogenic markers pparγ (g), cebpα (h), ucp1 (i), and fabp4 (j) at 2 dpf, 4 dpf, and 14 dpf (N = 3 biological replicates). k Representative images of Nile Red staining on 40 dpf (N = 3 biological replicates). Scale bar = 100 μm. l Violin graph of NileRed staining intensity analysis on 40 dpf (N = 3 biological replicates). m Representative images of Oil Red O staining sections (N = 3 biological replicates). Scale bar = 50 μm. n Representative images of Hematoxylin and Eosin (H&E) sections (N = 3 biological replicates). Scale bar = 50 μm. o, p qRT-PCR analysis of per1a (o) and rorb (p) (N = 3 biological replicates). Data are presented as the mean ± S.D. Statistical analysis was performed using two-tailed unpaired Student’s t-test. *P < 0.05, **P < 0.01, ***P < 0.001
|