
- Title
-
A Zebrafish-Based Platform for High-Throughput Epilepsy Modeling and Drug Screening in F0
- Authors
- Locubiche, S., Ordóñez, V., Abad, E., Scotto di Mase, M., Di Donato, V., De Santis, F.
- Source
- Full text @ Int. J. Mol. Sci.
|
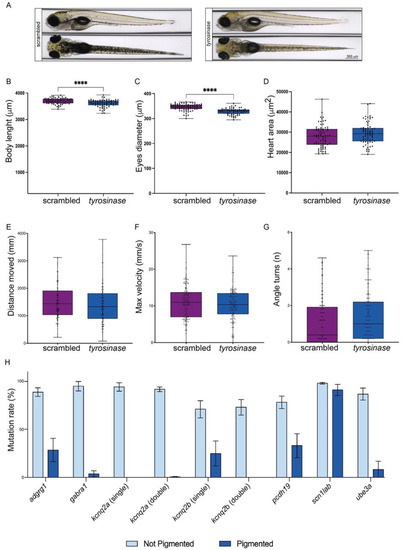
Characterization of |
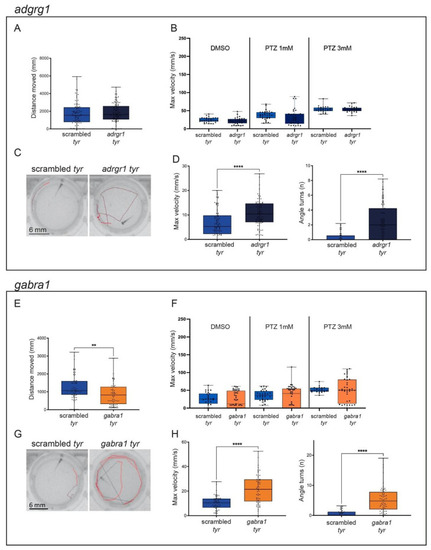
Characterization of |
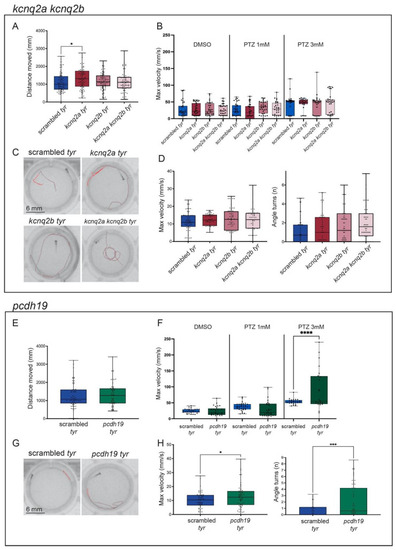
Characterization of |
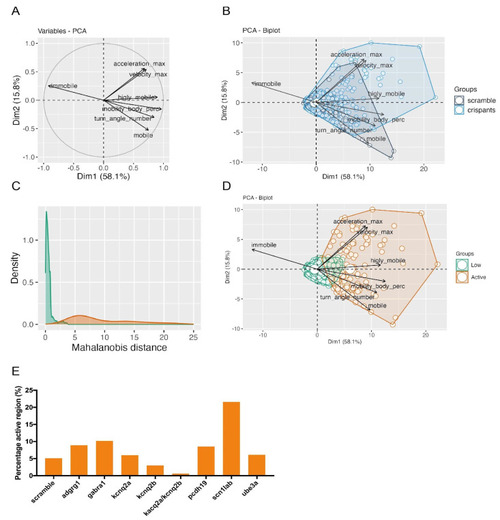
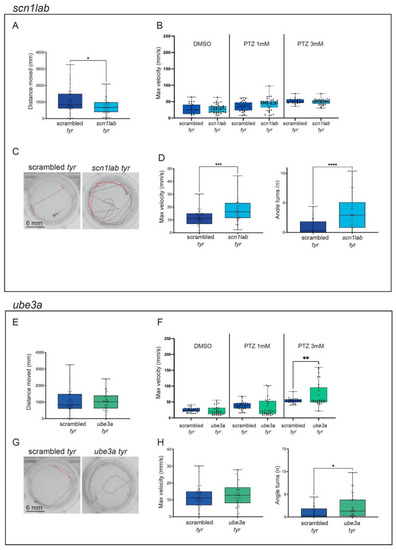
The identification of crispants with the greatest photosensitivity can be obtained through a multiparametric analysis of their reaction to light flashes. ( |
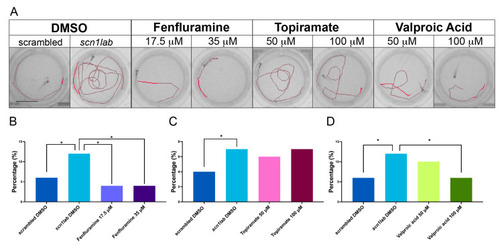
Incubating |