IMAGE

Figure 5

ID
ZDB-IMAGE-240315-56
Source
Figures for Locubiche et al., 2024
Image
Figure Caption

Figure 5

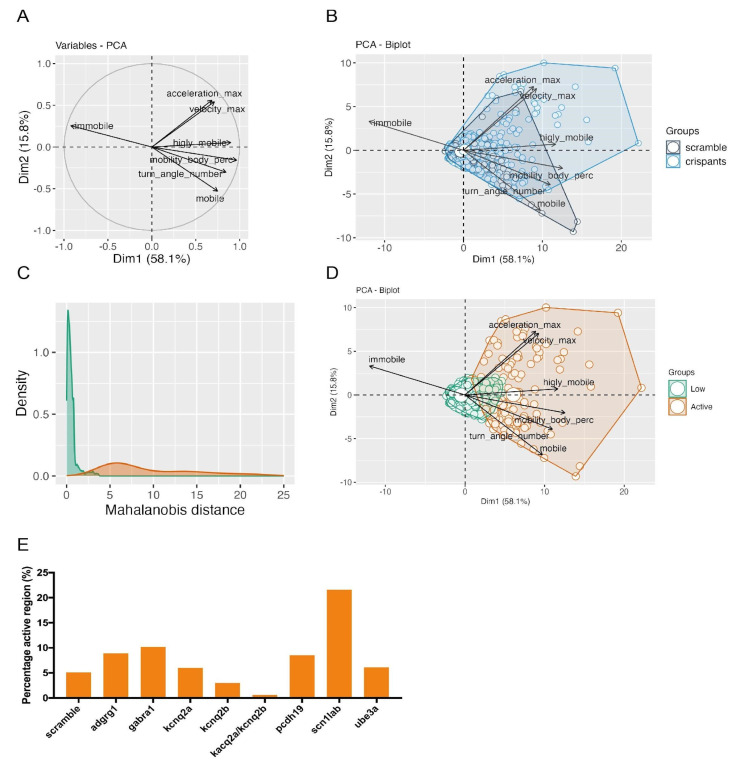
The identification of crispants with the greatest photosensitivity can be obtained through a multiparametric analysis of their reaction to light flashes. (A): Bidimensional plot of the different variables selected as more relevant to perform the principal component analysis (PCA), with a vectorial representation. The selected variables are maximum velocity (mm/s), the number of angle turns, maximum acceleration (mm/s2), angular velocity (deg/s), mobility in the arena (%) and the cumulative duration (s) of three different mobility states, immobile, mobile and highly mobile. (B): PCA biplot comparing two main groups, the scrambled (in black) and the different studied crispants related to childhood epileptic genes (in blue). (C): The definition of two different populations depending on their activity through the calculation of Mahalanobis distance. The low activity group (in green) represents the population of analyzed larvae with a non-epileptic behavior; the high activity group (in orange) represents the population of analyzed larvae with an epileptic-like behavior in response to light flashes. (D): PCA biplot comparing the two main groups described through the Mahalanobis distance analysis, considering the different PCA variables. (E): A representation of the percentage of larvae classified in the epileptic-like population of the scrambled and all the selected crispants.

Acknowledgments
This image is the copyrighted work of the attributed author or publisher, and ZFIN has permission only to display this image to its users. Additional permissions should be obtained from the applicable author or publisher of the image. Full text @ Int. J. Mol. Sci.