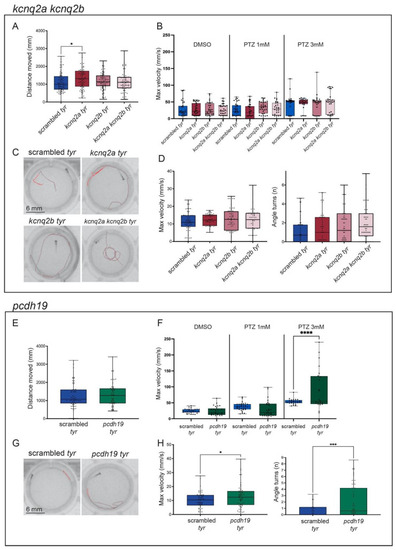
Characterization of kcnq2a, kcnq2b, double kcnq2a/kcnq2b and pcdh19 crispants. (A–D). Representation of kcnq2a, kcnq2b and double kcnq2a/kcnq2b measurements in behavioral studies: distance moved (mm) during the dark/light cycles (A), the maximum velocity (mm/s) during the light phase in response to different PTZ concentrations (DMSO, PTZ 1 mM and PTZ 3 mM) (B), representative tracking images of scrambled (top left), kcnq2a crispants (top right), kcnq2b crispants (bottom left) and double kcnq2a/kcnq2b crispants (bottom right) after the light stimuli to induce convulsions (C), and the maximum speed (mm/s) and angle turns measures after the light stimuli (D). (E–H). Representation of pcdh19 measurements in behavioral studies: distance moved (mm) during the dark/light cycles (E), the maximum velocity (mm/s) during the light phase in response to different PTZ concentrations (DMSO, PTZ 1 mM and PTZ 3 mM) (F), representative tracking images of scrambled (left) and pcdh19 crispants (right) after the light stimuli to induce convulsions (G) and the maximum speed (mm/s) and angle turns measures after the light stimuli (H). Scrambled are represented in blue, kcnq2a crispants are represented in red, kcnq2b crispants are represented in pink, double kcnq2a/kcnq2b crispants are represented in light pink and pcdh19 crispants are represented in orange. The error bar represents the minimum to maximum values. * p < 0.05, *** p < 0.005, **** p < 0.001 (t-test).
|
