|
Figure 6
Incubating

|
|
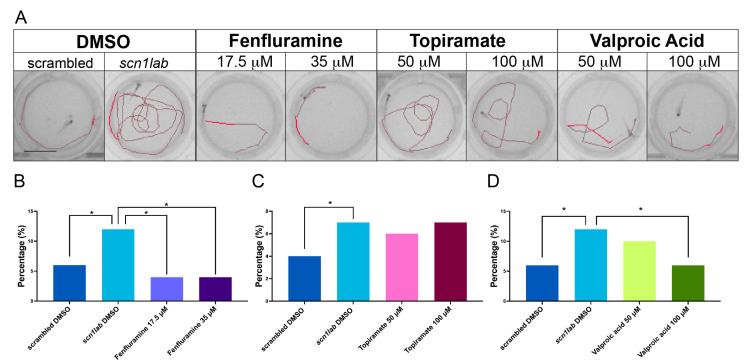
Figure 6
Incubating