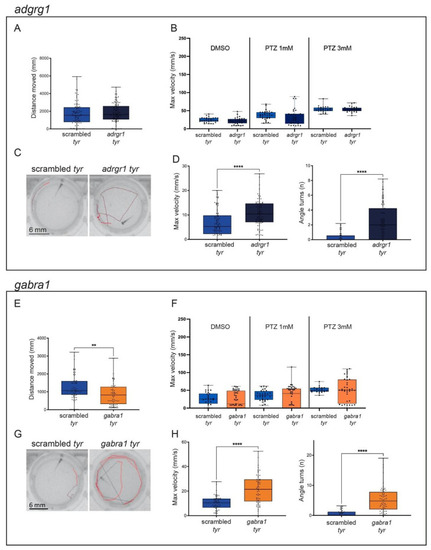
Characterization of adgrg1 and gabra1 crispants. (A–D). Representation of adgrg1 measurements in behavioral studies: distance moved (mm) during the dark/light cycles (A), the maximum velocity (mm/s) during the light phase in response to different PTZ concentrations (DMSO, PTZ 1 mM and PTZ 3 mM) (B), representative tracking images of scrambled (left) and adgrg1 crispants (right) after the light stimuli to induce convulsions (C) and the maximum speed (mm/s) and angle turns measures after the light stimuli (D). (E–H). Representation of gabra1 measurements in behavioral studies: distance moved (mm) during the dark/light cycles (E), the maximum velocity (mm/s) during the light phase in response to different PTZ concentrations (DMSO, PTZ 1 mM and PTZ 3 mM) (F), representative tracking images of scrambled (left) and gabra1 crispants (right) after the light stimuli to induce convulsions (G) and the maximum speed (mm/s) and angle turns measures after the light stimuli (H). Scrambled are represented in blue, adgrg1 crispants are represented in dark blue and gabra1 crispants are represented in orange. The error bar represents the minimum to maximum values. ** p < 0.01, **** p < 0.001 (t-test). Next, we decided to test the possibility of inducing epileptic-like behavior by exposing the crispants to different epileptogenic stimuli. In order to trigger seizures, we employed two kinds of stimuli, namely incubation with Pentylenetetrazole (PTZ) and exposure to intermittent flashes of light. PTZ is a pro-convulsant commonly used as a pharmacological epilepsy model [25,28,39,40,41] while flashing or flickering lights are known to cause photosensitive seizures in a large number of patients affected by epilepsy [20].
|
