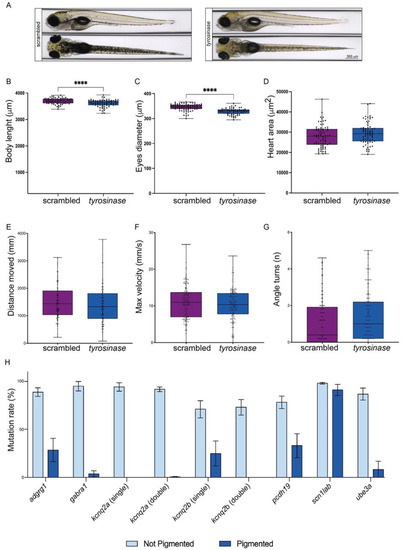
Tyr loss of function enables the selection of crispants with the highest mutation rate while keeping other behavioral and developmental parameters unchanged. (A): Dorsal (lower panels) and lateral (upper panels) images of scrambled (left panels) and tyrosinase crispants (right panels), with a reduction in pigmentation in the latest. (B–D): Analysis and comparison of different relevant morphological phenotypes in both crispants (scrambled are represented in purple; tyrosinase crispants are represented in blue. The error bar represents the minimum to maximum values): body length (µm) (B), the diameter of the eyes (µm) (C) and heart area (µm2) (D). (E–G): Analysis and comparison of the most relevant parameters related to epilepsy in both crispants (scrambled are represented in purple; tyrosinase crispants are represented in blue. Error bar represents the minimum to maximum values): distance moved (mm) during the dark/light cycles phase (E), maximum velocity achieved after the light flashes (mm/s) (F) and the number of angle turns after the light flashes (G). (H): Bar plot showing the mutagenesis efficiency observed in the targeted loci in pigmented larvae (dark blue) and unpigmented larvae (light blue). From left to right: mutation rate observed in the adrgr1 CDS in adrgr1 crispants; mutation rate observed in the gabra1 CDS in gabra1 crispants; mutation rate observed in the kcnq2a CDS in kcnq2a single crispants; mutation rate observed in the kcnq2a CDS in kcnq2a-kcnq2b double crispants; mutation rate observed in the kcnq2b CDS in kcnq2b single crispants; mutation rate observed in the kcnq2b CDS in kcnq2a-kcnq2b double crispants; mutation rate observed in the pcdh19 CDS in pcdh19 crispants; mutation rate observed in the scn1lab CDS in scn1lab crispants; mutation rate observed in the ube3a CDS in ube3a crispants. Error bars represent the standard error of the mean (SEM), **** p < 0.001 (t-test).
|
