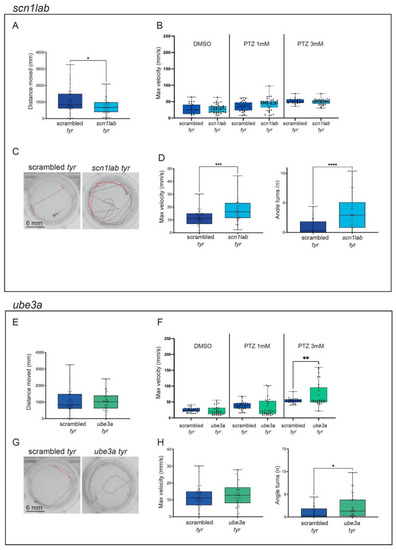
Characterization of scn1lab and ube3a crispants. (A–D). Representation of scn1lab measurements in behavioral studies: distance moved (mm) during the dark/light cycles (A), the maximum velocity (mm/s) during the light phase in response to different PTZ concentrations (DMSO, PTZ 1 mM and PTZ 3 mM) (B), representative tracking images of scrambled (left) and scn1lab crispants (right) after the light stimuli to induce convulsions (C) and the maximum speed (mm/s) and angle turns measures after the light stimuli (D). (E–H). Representation of ube3a measurements in behavioral studies: distance moved (mm) during the dark/light cycles (E), the maximum velocity (mm/s) during the light phase in response to different PTZ concentrations (DMSO, PTZ 1 mM and PTZ 3 mM) (F), representative tracking images of scrambled (left) and ube3a crispants (right) after the light stimuli to induce convulsions (G) and the maximum speed (mm/s) and angle turns measures after the light stimuli (H). Scrambled are represented in blue, scn1lab crispants are represented in light blue and ube3a crispants are represented in green. The error bar represents the minimum to maximum values. * p < 0.05, ** p < 0.01, *** p < 0.005, **** p < 0.001 (t-test).
|
