FIGURE SUMMARY
Title

Enhancer trap lines with GFP driven by smad6b and frizzled1 regulatory sequences for the study of epithelial morphogenesis in the developing zebrafish inner ear

Authors
Baldera, D., Baxendale, S., van Hateren, N.J., Marzo, M., Glendenning, E., Geng, F.S., Yokoya, K., Knight, R.D., Whitfield, T.T.
Source
Full text @ J. Anat.

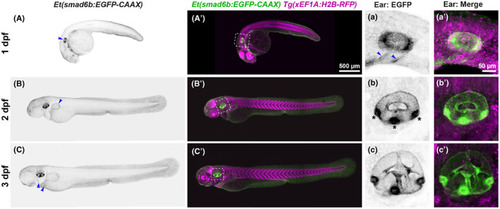
Expression of the Et(smad6b: EGFP‐CAAX) line. (A–C′) Whole mount images of Et(smad6b:EGFP‐CAAX); Tg(xEF1A:H2B‐RFP) double transgenic embryos taken with a Nikon CSU‐W1 spinning disk confocal microscope at 1, 2 and 3 days post fertilisation (dpf); lateral views, anterior to the left. Arrowhead in (A) marks the otic vesicle. Panels (a–c') show maximum intensity projection (MaxIP) enlargements of EGFP expression in the otic vesicle at 1–3 dpf, corresponding to the white boxes in (A'–C′). Strong expression is present in the three cristae (b, asterisks). EGFP expression is also seen in the pharyngeal region at 24 hpf (a, arrowhead) and in the developing pectoral fin (B, arrowhead) at all stages. Lower level expression is present throughout the skin at all stages and in the forming opercle and cleithrum at 3 dpf (C, arrowheads). The Tg(xEF1A: H2B‐RFP) line provides a counterstain for all nuclei (magenta). Scale bars: 500 μm in (A'), for (A–C′); 50 μm in (a') for (a–c').

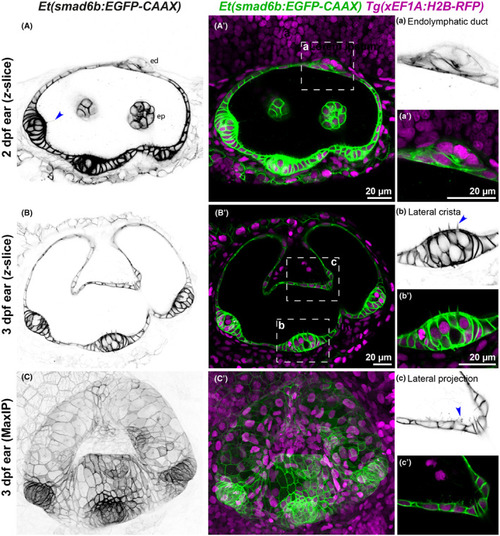
Et(smad6:EGFP) expression reveals cell shape details in the inner ear. (A–C′) Images of the otic vesicle of Et(smad6b:EGFP‐CAAX) embryos taken with a Zeiss Airyscan microscope at 2 and 3 dpf; lateral views, anterior to the left. (A–B′) Single z‐slice images at 2 dpf (A, A'), 3 dpf (B, B′) and Maximum Intensity Projection (MaxIP) of 3 dpf (C, C′). Panels (A–C) show inverted images of EGFP expression; (A–C′) show Et(smad6b: EGFP‐CAAX) expression in green and Tg(xEF1A: H2B‐RFP) expression in all nuclei in magenta. The inverted image reveals details such as the kinocilia (A, arrowhead) on crista hair cells. Regions of interest highlighting cellular details (white boxes on the middle images) are enlarged on the right with the inverted green channel (a–c) and merged channels (a'–c'). (a, a') Endolymphatic duct emerging from dorsal otic epithelium. (b, b') Lateral crista showing pseudostratified epithelium and hair cells with stereocilia (b, arrowhead). (c, c') Part of the lateral projection showing membranous protrusions from the basal surface of otic epithelial cells (c, arrowhead). Abbreviations in (A): ed, endolymphatic duct; ep, epithelial projection. Scale bars: 20 μm in A', for A; 20 μm in B′, for B, C, C′; 20 μm in a', for a; 20 μm in b' for b, c, c'.

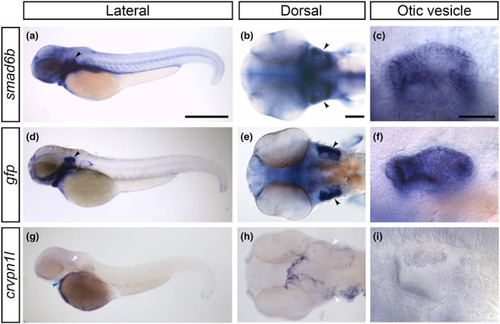
Comparison of smad6b and crvpn1l expression in wild‐type embryos w the expression of the gfp transgene in Et(smad6b: EGFP‐CAAX) transgenic embryos. (a–i) Whole mount in situ hybridisation at 48 h post fertilisation (hpf) showing smad6b expression in wild‐type embryos (a–c), gfp expression in Et(smad6b:EGFP‐CAAX) embryos (d–f), and crvpn1l expression in wild‐type embryos (g–i); anterior to the left. (a, d, g) Lateral views of the whole embryo. Note the similar expression domains for smad6b (a) and gfp (d), with relatively strong gfp expression in the ear (marked by black arrowheads). Expression of crvpn1l (g) is absent in the ear (white arrowheads), but is present over the yolk sac (blue arrowhead). (b, e, h) Dorsal view of the head at 48 hpf showing expression of smad6b (b) gfp (e) and crvpn1l (h). Note the closely matching spatial expression domains of smad6b and gfp, with stronger expression laterally in the otic vesicles (d, e, arrowheads). (h) Dorsal view of the head showing expression of crvpn1l at 48 hpf, in a different pattern to that of the gfp mRNA (compare with [e]). (c, f, i) Detailed lateral views of the otic vesicle, showing the matching expression of smad6b (c) and gfp (f) throughout the otic vesicle. No otic expression is seen for crvpn1l (I). Scale bars: 500 μm in (a), for (d, g); 100 μm in (b), for (e, h); 50 μm in (c), for (f, i).

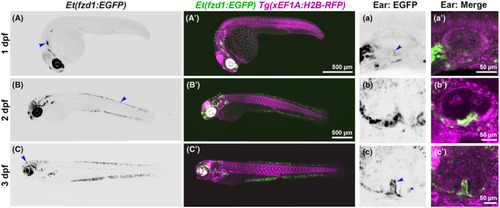
Expression of the Et(fzd1:EGFP) line. (A–C') Whole mount images of Et(fzd1:EGFP) embryos taken with a Nikon CSU‐W1 spinning disk confocal microscope at 1, 2, and 3 dpf, anterior left. (a–c') Enlarged images of the otic vesicle at 1–3 dpf, corresponding to the white boxes in (A'–C′). Panels (A–C) and (a–c) are MaxIP inverted images of the EGFP expression; (A'–C′) and (a'–c') show the merged channels, with Et(fzd1:EGFP) expression in green and Tg(xEF1A:H2B‐RFP) expression in all nuclei in magenta. All are MaxIP images with the exception of (b'), which is a single z‐slice to show the GFP expression in ventral otic epithelium. (A–a') At 1 dpf, GFP expression is strongest in the retina and lens of the eye, and anterior (A, arrowhead) and posterior lateral line ganglia, with weaker expression in the midbrain and forebrain. Occasionally, some embryos also have expression in the epiphysis and heart. Expression in the otic vesicle at 1 dpf is limited to one or two cells (a arrowhead). (B–b') At 2 dpf, strong staining persists in the eye, and midbrain expression increases. New expression in the dorsal and ventral fins is strong in a subset of cells (B, arrowhead). In the otic vesicle, Et(fzd1:EGFP) expression is strongest in a ventral domain (b, b'). (C–c') At 3 dpf, expression of Et(fzd1:EGFP) is maintained in the fins and reduced in the eye and brain. Expression in the epiphysis can still be seen in some embryos (C, arrowhead). In the otic vesicle, most cells of the ventral pillar are marked by GFP expression (c, arrowhead; see also Figure 5). Scale bars: 500 μm in (A'), for (A); 500 μm in (B′), for (B′, C, C′); 50 μm in (a') for (a), in (b) for (b') and in (c) for (c').

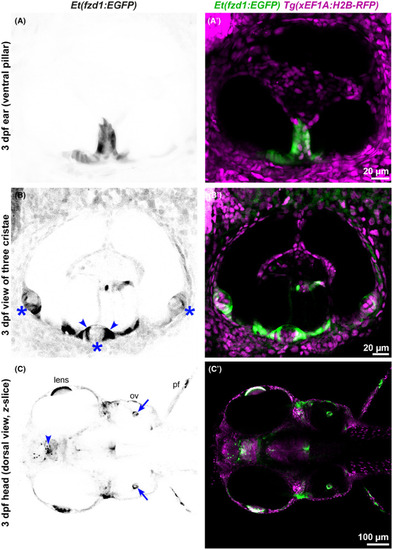
Expression of the Et(fzd1:EGFP) line in the developing inner ear. (A–C′) Images of the otic vesicle of Et(fzd1:EGFP) embryos taken with a Nikon CSU‐W1 spinning disk confocal microscope at 3 dpf; lateral views with anterior to the left. All are single z‐slice images taken at different focal planes. (A–C) Inverted images of GFP expression. (A'–C′) Merged channel images showing Et(fzd1:EGFP) expression in green and Tg(xEF1A:H2B‐RFP) expression in all nuclei in magenta. (A, A') Lateral view of the ventral pillar, marked by expression of GFP. (B, B′) GFP expression in the three cristae (B, asterisks) is strongest in the supporting cells at the margins of the lateral crista (B, arrowheads; compare to the fzd1 mRNA expression in Figure 6f, inset). (C, C′) Dorsal view of the head at the level of the ventral pillar (C, arrows mark expression in the ventral pillars; compare to the fzd1 mRNA expression in Figure 6e). GFP is also expressed in the lens of the eye, epiphysis (C, arrowhead) and pectoral fins. Abbreviations in C: ov, otic vesicle; pf, pectoral fin. Scale bars: 20 μm in (A'), for (A); 20 μm in (B′), for (B); 100 μm in (C′) for (C).

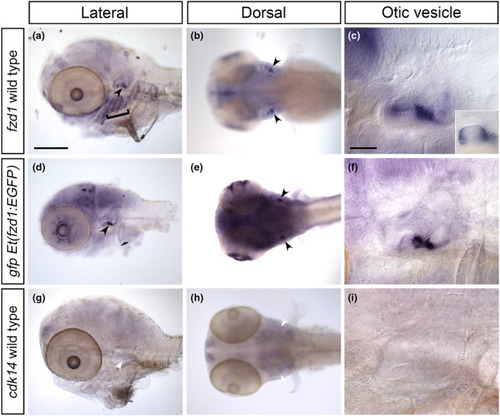
Comparison of fzd1 and cdk14 mRNA expression in wild‐type embryos to expression of gfp mRNA in Et(fzd1:EGFP) transgenic embryos. (A–I) Whole mount in situ hybridisation at 3 dpf, showing fzd1 expression in wild‐type embryos (A–C), gfp expression in Et(fzd1:EGFP) embryos (D–F) and cdk14 expression in wild‐type embryos (G–I); anterior to the left. (A, D, G) Lateral views of the head. Note the closely matching spatial expression domains of gfp and fzd1 genes in the otic vesicle (black arrowheads), whereas cdk14 is not expressed in the otic vesicle (white arrowheads). Expression of fzd1 is also present in the pharyngeal region in wild‐type embryos (A, bracket), but gfp expression is absent in this region in the Et(fzd1:EGFP) line (D). (B, E, H) Dorsal view of the head, clearly showing the ventral pillar expression (black arrowheads) in the ear of both fzd1 (B) and gfp (E). Expression of both fzd1 and gfp is also seen in part of the retina. (C, F, I) Detailed lateral views of the otic vesicle, showing the matching expression of fzd1 (C) and gfp (F) in the ventral pillar. Inset in C at a different focal plane shows expression of fzd1 at the lateral margins of the lateral (horizontal) crista, matching the GFP fluorescence shown in Figure 5b,b'. No expression in either the ventral pillar (H, white arrowheads) or lateral crista (I) is seen for cdk14. Scale bars: 200 μm in (A), for (B, D, E, G, H); 50 μm in (C), for (F, I).

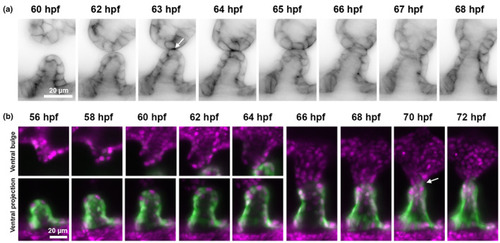
Imaging of ventral pillar formation in Et(smad6b:EGFP‐CAAX) and Et(fzd1:EGFP) ears. (A, B) Series of stills from time‐lapse movies of Et(smad6b:EGFP‐CAAX) (A, inverted greyscale) and Et(fzd1:EGFP) (B, green), showing the meeting and fusion of the ventral projection and the ventral bulge of the lateral projection to form the ventral pillar in the otic vesicle. Et(smad6b:EGFP‐CAAX) images clearly show the initial contact of cell membranes (A, arrow, 63 hpf). The Et(fzd1:EGFP) line marks the ventral projection but not the ventral bulge: GFP‐labelled and unlabelled cells can be seen meeting at the fusion plate (B, arrow, 70 hpf). Tg(xEF1A: H2B‐RFP) expression (magenta) marks all nuclei. Scale bars: 20 μm in (A) (applies to all panels); 20 μm in (B) (applies to all panels).

Acknowledgments
This image is the copyrighted work of the attributed author or publisher, and ZFIN has permission only to display this image to its users. Additional permissions should be obtained from the applicable author or publisher of the image. Full text @ J. Anat.