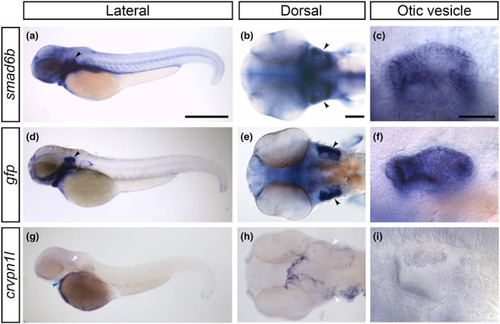
Comparison of smad6b and crvpn1l expression in wild‐type embryos w the expression of the gfp transgene in Et(smad6b: EGFP‐CAAX) transgenic embryos. (a–i) Whole mount in situ hybridisation at 48 h post fertilisation (hpf) showing smad6b expression in wild‐type embryos (a–c), gfp expression in Et(smad6b:EGFP‐CAAX) embryos (d–f), and crvpn1l expression in wild‐type embryos (g–i); anterior to the left. (a, d, g) Lateral views of the whole embryo. Note the similar expression domains for smad6b (a) and gfp (d), with relatively strong gfp expression in the ear (marked by black arrowheads). Expression of crvpn1l (g) is absent in the ear (white arrowheads), but is present over the yolk sac (blue arrowhead). (b, e, h) Dorsal view of the head at 48 hpf showing expression of smad6b (b) gfp (e) and crvpn1l (h). Note the closely matching spatial expression domains of smad6b and gfp, with stronger expression laterally in the otic vesicles (d, e, arrowheads). (h) Dorsal view of the head showing expression of crvpn1l at 48 hpf, in a different pattern to that of the gfp mRNA (compare with [e]). (c, f, i) Detailed lateral views of the otic vesicle, showing the matching expression of smad6b (c) and gfp (f) throughout the otic vesicle. No otic expression is seen for crvpn1l (I). Scale bars: 500 μm in (a), for (d, g); 100 μm in (b), for (e, h); 50 μm in (c), for (f, i).
|

