IMAGE

FIGURE 2

ID
ZDB-IMAGE-230619-4
Source
Figures for Baldera et al., 2023
Image
Figure Caption

FIGURE 2

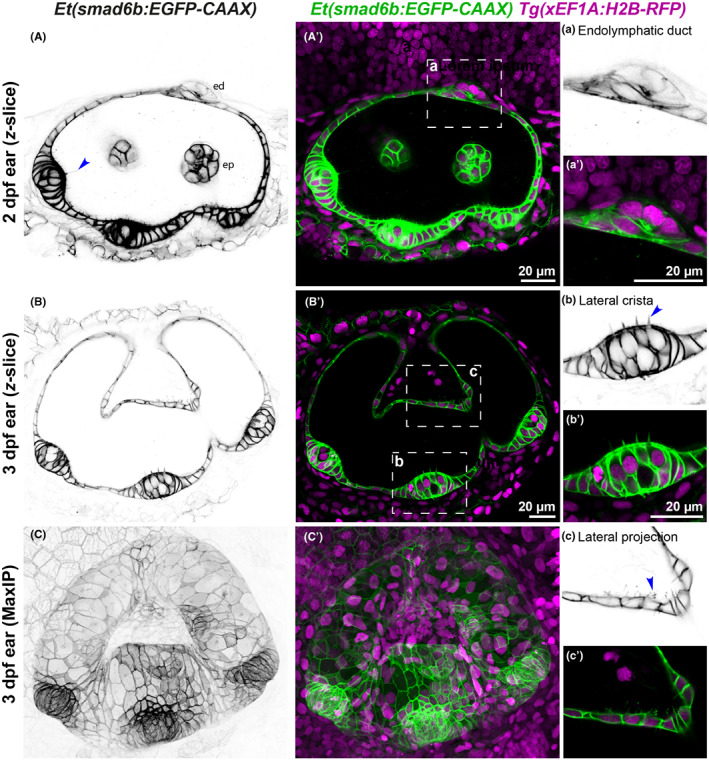
Et(smad6:EGFP) expression reveals cell shape details in the inner ear. (A–C′) Images of the otic vesicle of Et(smad6b:EGFP‐CAAX) embryos taken with a Zeiss Airyscan microscope at 2 and 3 dpf; lateral views, anterior to the left. (A–B′) Single z‐slice images at 2 dpf (A, A'), 3 dpf (B, B′) and Maximum Intensity Projection (MaxIP) of 3 dpf (C, C′). Panels (A–C) show inverted images of EGFP expression; (A–C′) show Et(smad6b: EGFP‐CAAX) expression in green and Tg(xEF1A: H2B‐RFP) expression in all nuclei in magenta. The inverted image reveals details such as the kinocilia (A, arrowhead) on crista hair cells. Regions of interest highlighting cellular details (white boxes on the middle images) are enlarged on the right with the inverted green channel (a–c) and merged channels (a'–c'). (a, a') Endolymphatic duct emerging from dorsal otic epithelium. (b, b') Lateral crista showing pseudostratified epithelium and hair cells with stereocilia (b, arrowhead). (c, c') Part of the lateral projection showing membranous protrusions from the basal surface of otic epithelial cells (c, arrowhead). Abbreviations in (A): ed, endolymphatic duct; ep, epithelial projection. Scale bars: 20 μm in A', for A; 20 μm in B′, for B, C, C′; 20 μm in a', for a; 20 μm in b' for b, c, c'.

Acknowledgments
This image is the copyrighted work of the attributed author or publisher, and ZFIN has permission only to display this image to its users. Additional permissions should be obtained from the applicable author or publisher of the image. Full text @ J. Anat.