FIGURE SUMMARY
Title

Generation and Application of the Zebrafish heg1 Mutant as a Cardiovascular Disease Model

Authors
Lu, S., Hu, M., Wang, Z., Liu, H., Kou, Y., Lyu, Z., Tian, J.
Source
Full text @ Biomolecules

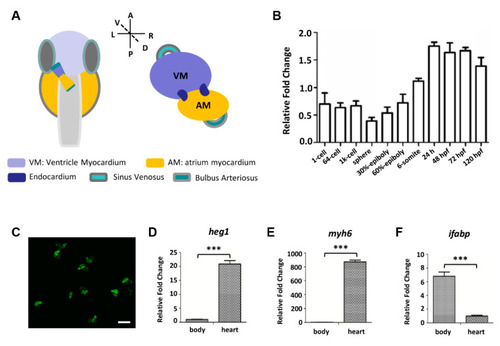
The expression level of heg1 in zebrafish heart tissue. (A) Overview of zebrafish embryos heart, dorsal view (VM: Ventricle Myocardium; AM: atrium myocardium). (B) qRT-PCR analysis of heg1 transcript levels from 1-cell to 120 hpf. (C) Purified heart tissues from Tg(cmlc2:eGFP) transgenic fish embryos at 72 hpf. heg1 (D) and myh6 (E) were highly expressed in purified heart tissue compared with the expression in body tissue as determined by qRT-PCR. (F) The expression level of ifabp in purified heart tissue was much lower than that in body tissue as analyzed by qRT-PCR. Scale bar: 100 μm. *** indicates p < 0.001 by Student’s t-test.

EXPRESSION / LABELING:
Genes:
Fish:
Anatomical Terms:
Stage Range: 1-cell to Day 5

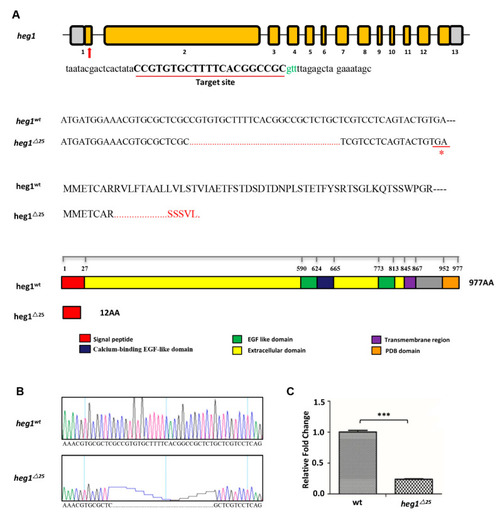
The generation of heg1 deficient zebrafish using CRISPR/Cas9 technology. (A) Schematic view of zebrafish heg1 genomic and protein domains. The gRNA sequence for the exon 1 targeting site was labelled by a red line. The CRISPR/Cas9-induced mutation (25-base deletion) in heg1 exon1 and a truncated 12 amino acids at the N-terminus were shown. (B) Sanger sequencing confirmed the 25-nt deletion mutation. (C) qRT-PCR confirmation that heg1 expression was significantly decreased in heg125 embryos, n = 30 embryos per group. Data are represented as mean ± SE. *** p < 0.001.

EXPRESSION / LABELING:
Gene:
Fish:
Anatomical Term:
Stage: Protruding-mouth
PHENOTYPE:
Fish:
Observed In:
Stage: Protruding-mouth

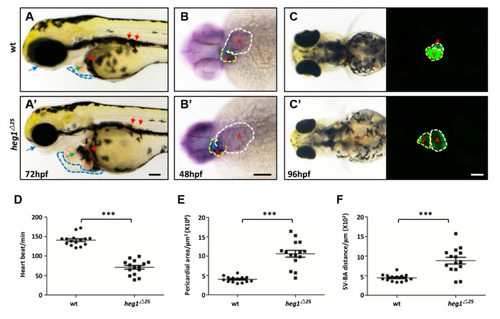
heg1 deficiency leaded to abnormal cardiac development in zebrafish embryos. (A,A’) Lateral view of zebrafish larvae at 72 hpf. Representative images of the heg125 and wt embryos, exhibiting pericardial edema (blue dotted-line boxes), enlarged heart size (green arrow), venous congestion (red arrow), and eye edema (blue arrow). (B,B’) Representative images of the heg125 and wt embryos at 48 hpf stained for the heart marker cmlc1. Note the enlargement heart in heg125 mutants (V: Ventricular, yellow dotted-line boxes; A: atria, white dotted-line boxes, ventral view). (C,C’) The heart morphology was delineated by Tg(cmlc2:GFP) (ventral view). (D) Heart rate in wt and heg1∆25 mutant zebrafish larvae (n = 15 embryos/group). (E) The pericardial area in wt and heg125 mutant zebrafish larvae (n = 15 embryos/group). (F) The SV-BA distance in wt and heg125 mutant zebrafish larvae (n = 15 embryos /group). Scale bar: 100 μm. *** indicates p < 0.001 by Student’s t-test.

EXPRESSION / LABELING:
Gene:
Fish:
Anatomical Terms:
Stage: Long-pec
PHENOTYPE:
Fish:
Observed In:
Stage Range: Long-pec to Day 4

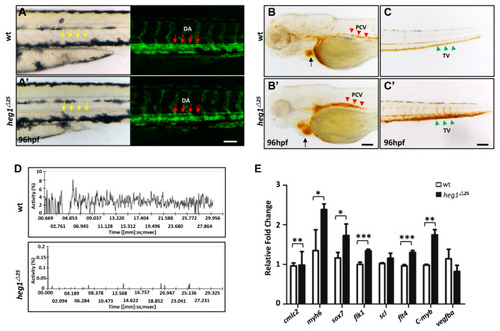
heg1 deficiency leaded to poor blood flow and abnormal vascular development in zebrafish embryos. (A) Lateral view of zebrafish larvae at 96 hpf. Representative images of the heg125 and wt embryos, exhibiting blood congestion (yellow arrows), and dilation of dorsal aorta (DA) lumen (red arrows) in caudal vein. (B,C) Representative images of the heg125 and wt embryos, showing red blood cells (RBCs) accumulation in posterior cardinal vein (PCV) (red arrowhead), tail vein (TV) (green arrowhead) and heart (black arrow). (D) The movement ratio of RBCs based on changes in pixel density of PVC. (E) The expressions of cardiovascular markers, as determined by qRT-PCR, were significantly changed in heg1∆25 mutants at 48 hpf. Data are represented as mean ± SE from three independent experiments, * p < 0.05, ** p < 0.01, and *** p < 0.001 (Student’s t-test).

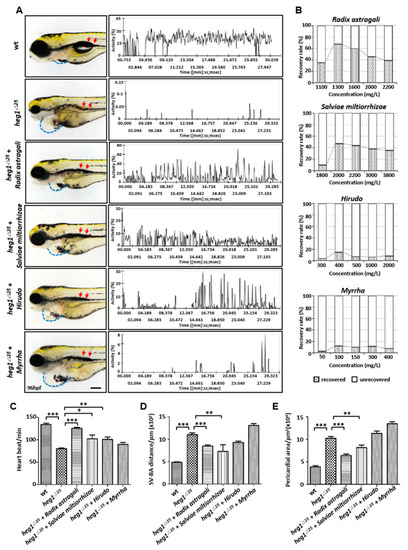
TCM pharmacological validation of heg1∆25 zebrafish mutant. (A) Phenotype observation and the relative movement of RBCs in PVC analysis of heg1∆25 embryos treated with four TCM herbs. (B) The optimal concentrations of the four drugs, as indicated as Radix astragali 1300 mg/L, Salviae miltiorrhiza 2000 mg/L, Hirudo 400 mg/L, and Myrrha 100 mg/L, respectively. N = 40 embryos for each concentrations. (C) Comparison of heart rate of zebrafish embryos in each group. (D) Comparison of SV-BA distance of zebrafish embryos in each group. (E) Comparison of pericardial area of zebrafish embryos in each group. Data are represented as mean ± SE from three independent experiments, * p < 0.05, ** p < 0.01, and *** p < 0.001 (Student’s t-test).

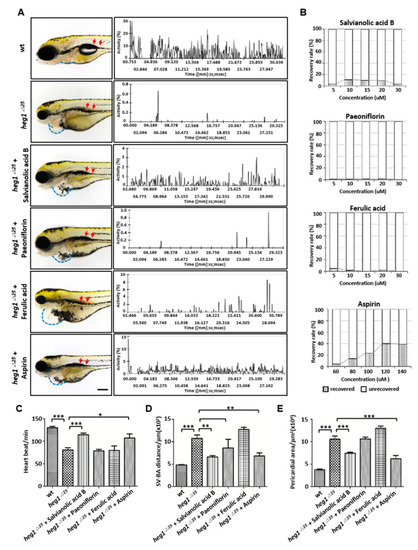
Monomers pharmacological validation of heg1∆25 zebrafish mutants. (A) Phenotype observation and the relative movement of RBCs in PVC analysis of heg1∆25 embryos treated with four monomers. (B) The optimal concentrations of the four monomers, salvianolic acid B, paeoniflorin, ferulic acid and aspirin. N = 40 embryos for each concentration. (C) Comparison of heart rate of zebrafish embryos in each group. (D) Comparison of SV-BA distance of zebrafish embryos in each group. (E) Comparison of pericardial area of zebrafish embryos in each group. Data are represented as mean ± SE from three independent experiments, * p < 0.05, ** p < 0.01, and *** p < 0.001 (Student’s t-test).

Acknowledgments
This image is the copyrighted work of the attributed author or publisher, and ZFIN has permission only to display this image to its users. Additional permissions should be obtained from the applicable author or publisher of the image. Full text @ Biomolecules