IMAGE

Figure 3

ID
ZDB-IMAGE-201130-75
Genes
Source
Figures for Lu et al., 2020
Image
Figure Caption

Figure 3

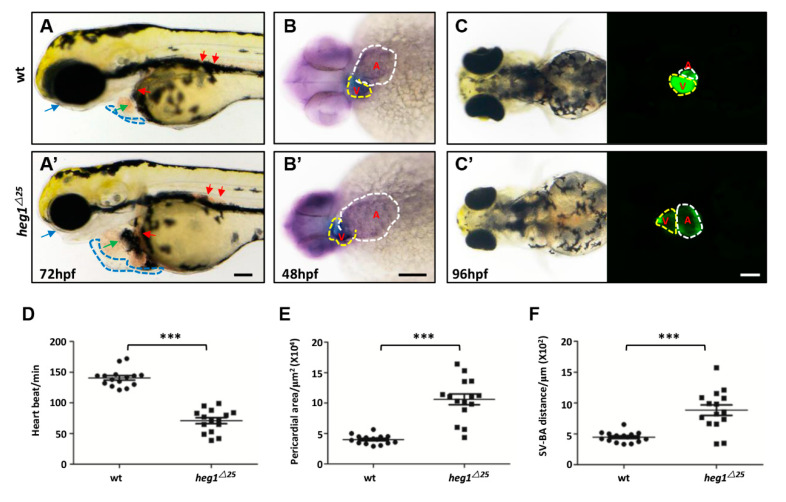
heg1 deficiency leaded to abnormal cardiac development in zebrafish embryos. (A,A’) Lateral view of zebrafish larvae at 72 hpf. Representative images of the heg125 and wt embryos, exhibiting pericardial edema (blue dotted-line boxes), enlarged heart size (green arrow), venous congestion (red arrow), and eye edema (blue arrow). (B,B’) Representative images of the heg125 and wt embryos at 48 hpf stained for the heart marker cmlc1. Note the enlargement heart in heg125 mutants (V: Ventricular, yellow dotted-line boxes; A: atria, white dotted-line boxes, ventral view). (C,C’) The heart morphology was delineated by Tg(cmlc2:GFP) (ventral view). (D) Heart rate in wt and heg1∆25 mutant zebrafish larvae (n = 15 embryos/group). (E) The pericardial area in wt and heg125 mutant zebrafish larvae (n = 15 embryos/group). (F) The SV-BA distance in wt and heg125 mutant zebrafish larvae (n = 15 embryos /group). Scale bar: 100 μm. *** indicates p < 0.001 by Student’s t-test.

Figure Data
Acknowledgments
This image is the copyrighted work of the attributed author or publisher, and ZFIN has permission only to display this image to its users. Additional permissions should be obtained from the applicable author or publisher of the image. Full text @ Biomolecules