- Title
-
Fscn1 is required for the trafficking of TGF-β family type I receptors during endoderm formation
- Authors
- Liu, Z., Ning, G., Xu, R., Cao, Y., Meng, A., Wang, Q.
- Source
- Full text @ Nat. Commun.
|
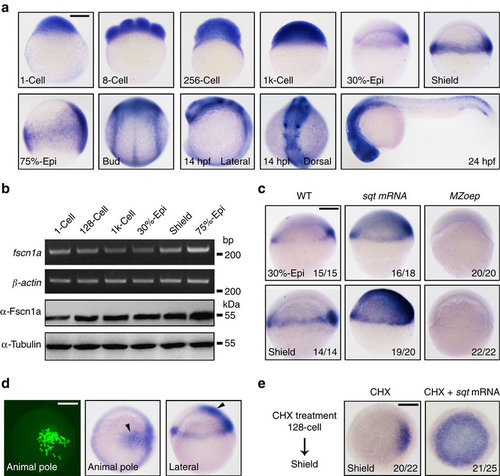
Zebrafish fscn1a is a direct TGF-β/Nodal target gene. (a) The spatiotemporal expression pattern of fscn1a during zebrafish embryogenesis was examined by in situ hybridization at the indicated stages. Stages and directionality are as follows: From the 1-cell to 1k-cell stages, lateral views with animal pole to the top; from 30% epiboly to mid-gastrulation stages, lateral views with dorsal to the right; bud stage, dorsal view with anterior to the top; 24 h.p.f., lateral views with anterior to the left. epi, epiboly. (b) Temporal expression profile of fscn1a was determined by semi-quantitative RT–PCR (upper panels) and western blot (lower panels). Total RNA isolates and proteins were prepared from embryos at the indicated stages. (c) fscn1a expression was assessed by in situ hybridization in wild-type (WT) and MZoep mutant embryos. Embryos injected with 1 pg sqt mRNA were also collected at the 30% epiboly and shield stages and subjected to in situ hybridization. The ratios of affected embryos are indicated. (d) 0.05 pg sqt mRNA was injected into a single cell located in the animal pole at the 64-cell stage. 20 pg egfp mRNA was co-injected as a cell lineage tracer. Left panel, EGFP-labelled cells were observed at the shield stage by fluorescence microscopy; middle and right panels, in situ hybridization analysis of fscn1a expression in shield stage embryos following single-cell injection. (e) fscn1a expression in sqt mRNA injected embryos after CHX treatment. Embryos were injected with 1 pg sqt mRNA at the one-cell stage and incubated with 50 µg ml-l CHX from the 128-cell to shield stages and then collected for in situ hybridization. Animal pole views with dorsal to the right. Scale bar, 200 µm. PHENOTYPE:
|
|
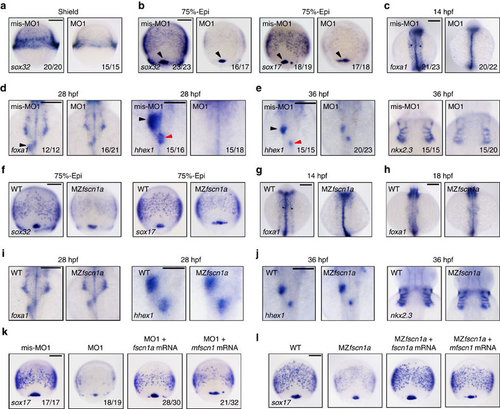
fscn1a-depletion disrupts endoderm formation. (a-e) The expression of endodermal markers in fscn1a morphants and control embryos at shield stage (a, Scale bar, 200 µm), 75% epiboly stage (b; Scale bar, 200 µm), 14 h.p.f. (c; Scale bar, 200 µm), 28 h.p.f. (d; Scale bar, 200 µm in the left two panels and 100 µm in the right two panels) and 36 h.p.f. (e; Scale bar, 200 µm). (a) Lateral views with dorsal to the right. (b-e) Dorsal views with anterior to the top. Dorsal forerunner cells (DFCs) were indicated by a black arrowhead (b) and the developing gut tube was indicated by black star (c). The liver and dorsal pancreatic buds were indicated by a black and a red arrowhead, respectively (d,e). Embryos in a, b, c and d were injected with 4 ng fscn1a mis-MO1 and MO1, while embryos in e were injected with 2 ng indicated MOs. (f-j) The expression of endodermal markers in MZfscn1a mutants and wild-type embryos at 75% epiboly stage (f; Scale bar, 200 µm), 14 h.p.f. (g; Scale bar, 200 µm), 18 h.p.f. (h; Scale bar, 200 µm), 28 h.p.f. (i; Scale bar, 200 µm in the left two panels and 100 µm in the right two panels) and 36 h.p.f. (j, Scale bar, 200 µm). Note that the formation of the endodermal related tissues including the developing gut tube, the liver and pancreatic buds and the endoderm pouches was progressively recovered from 18 h.p.f. in MZfscn1a mutants. (k,l) Ectopic expression of zebrafish fscn1a or mouse fscn1 (mfscn1) in fscn1a morphants (k; Scale bar, 200 µm) or MZfscn1a mutants (l; Scale bar, 200 µm) restores endoderm formation. Embryos were injected with 4 ng fscn1a MO1 alone or together with 150 pg fscn1a mRNA or mfscn1 mRNA at the one-cell stage and collected at the 75% epiboly stage for in situ hybridization. |
|
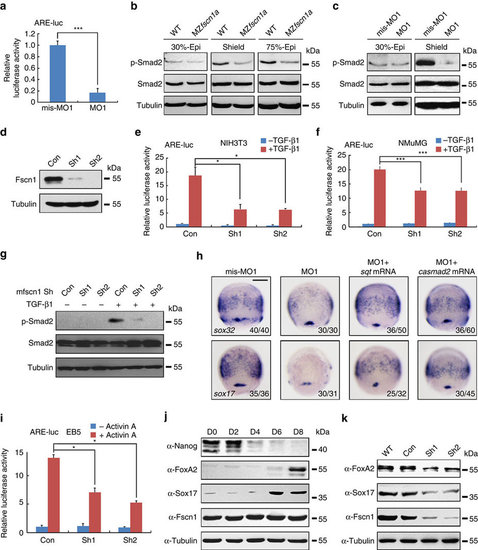
fscn1a-depletion inhibits Nodal signalling. (a) Reduction of ARE-luciferase reporter expression in fscn1a morphants. Embryos were co-injected with the reporter plasmids and mis-MO1 or MO1 at the one-cell stage and collected at the 75% epiboly stage for luciferase activity analysis. Data presented as mean with s.d. Student’s t test, n=3, ***P<0.001. (b,c) Wild-type and MZfscn1a mutant embryos (b) and embryos injected with mis-MO1 or MO1 (c) were collected at indicated stages for immunoblotting. (d) The effectiveness of mouse fscn1 shRNAs. NMuMG cells were transfected with 8 µg indicated shRNA plasmids per 100 mm dish and collected 48 h after transfection for western blot analyses. (e-g) NIH3T3 and NMuMG cells transfected with indicated shRNA plasmids (2 µg shRNA plasmids together with or without 0.5 µg reporter plasmids in one well of six-well plate) were treated with TGF-β1 (5 ng mll) for 12 h (e,f) or 3 h (g), and collected for luciferase measurements (e,f) or immunoblotting (g). The relative luciferase activity was the mean with s.d. from three independent biological repeats. Student’s t test, *P<0.05, ***P<0.001. (h) Overexpression of sqt or casmad2 rescues endoderm induction in fscn1a morphants. Embryos were injected with indicated MOs or mRNAs at the one-cell stage and collected at the 75% epiboly stage for in situ hybridization with sox32 and sox17 probes. Injection doses: mis-MO1, 4 ng; MO1, 4 ng; sqt mRNA, 1 pg; casmad2 mRNA, 100 pg. Scale bar, 200 µm. (i) EB5 cells transfected with ARE-luciferase reporter together shRNA plasmids and treated with or without 25 ng ml-1 Activin A for 12 h before collected for luciferase assays. Data presented as mean with s.d. Student’s t test, n=3, *P<0.05. (j) Western blots for the expression of Nanog, FoxA2, Sox17 and Fscn1 in samples taken at specified time points during embryoid body formation. The expression of Tubulin was examined as loading control. (k) Fscn1 knockdown disturbs the formation of endodermal cell lineage during embryoid body differentiation. Embryoid bodies on day 8, derived from EB5 cells infected with the indicated lentiviral shRNAs, were collected for western blots with indicated antibodies. EXPRESSION / LABELING:
PHENOTYPE:
|
|
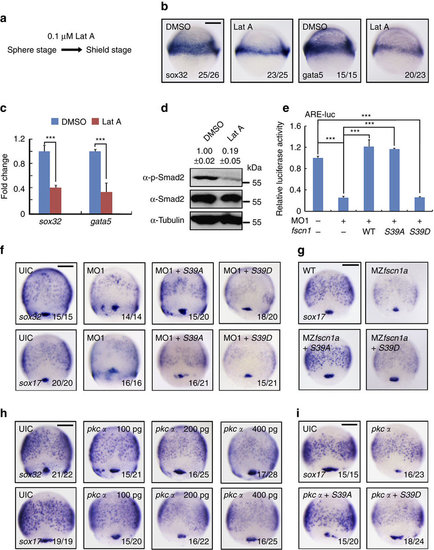
fscn1 regulates endoderm formation and Nodal signal transduction via its actin-bundling activity. (a-c) The expression of endoderm markers sox32 and gata5 in wild-type embryos and embryos treated with Lat A. Embryos were treated with 0.1 µM Lat A from the sphere stage to shield stage (a), and analysed by in situ hybridization (b) and real-time PCR (c) for sox32 and gata5 expression. In c, the expression of ²-actin was used as a reference to normalize the amount of mRNAs in each sample. The data are presented as mean ±s.d. of three independent experiments. Student’s t test, ***P<0.001. (d) Actin filaments regulate Nodal/Smad2 signal transduction. Wild-type embryos were treated with 0.1 µM Lat A from the sphere to shield stages and then harvested for immunoblotting. Quantification is the relative density of phospho-specific signals to corresponding total protein signals (mean±s.d., three independent biological repeats). (e-g) Overexpression of Fscn1 S39A, but not S39D, recovers the expression reduction of ARE-luciferase reporters and endodermal markers in fscn1a morphants and MZfscn1a mutants. Embryos were co-injected with the indicated MOs, plasmids and mRNAs at the one-cell stages and collected at the 75% epiboly stage for luciferase measurement (e) and in situ hybridization (f,g). The relative luciferase activity was the mean with s.d. from three independent experiments. Injection doses: ARE-luc, 100 pg; MO1, 4 ng; wild-type fscn1 mRNA, 150 pg; S39A mRNA, 150 pg; S39D mRNA, 150 pg. Student’s t test, ***P<0.001. (h) The expression of sox32 and sox17 were examined at the 75% epiboly stage in embryos injected with different dose of pkcα mRNA. (i) Fscn1 S39A overexpression antagonizes the PKCα-induced decrease of endoderm formation. One-cell stage embryos were co-injected with 400 pg pkcα mRNA and 150 pg Fscn1 S39A or S39D mRNA, then collected at the 75% epiboly stage for in situ hybridization and quantification of endodermal marker sox17 expression. Scale bar, 200 µm. EXPRESSION / LABELING:
PHENOTYPE:
|
|
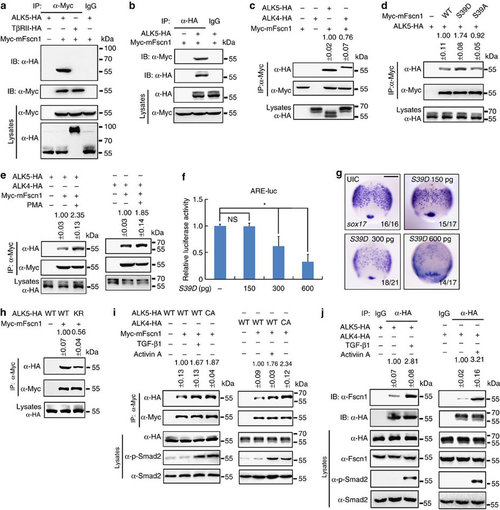
Fscn1 interacts with TGF-β family type I receptors. (a,b) Fscn1 interacts with TGF-β type I receptor ALK5. HEK293T cells were transfected as indicated with expression plasmids encoding Myc-tagged Fscn1 and HA-tagged- ALK5 or TGF-β type II receptor (TβRII) and collected for immunoprecipitation with anti-Myc (a) or anti-HA antibodies (b). (c) Fscn1 also associates with Nodal type I receptor ALK4. HEK293T cells transfected with the indicated constructs were subjected to immunoprecipitation. (d) Fscn1 S39D shows a stronger binding affinity for TGF-β family type I receptors. (e) PMA treatment elevates the receptor binding properties of Fscn1. HEK293T cells transfected with the indicated constructs were treated with 100 nM PMA for 2 h before collected for immunoprecipitation. (f,g) Embryos were co-injected with indicated doses of S39D mRNA at the one-cell stage and collected at the 75% epiboly stage for luciferase activity analysis (f) or in situ hybridization (g). Data presented as mean with s.d. Student’s t-test, n=3, *P<0.05. NS, non-significant. UIC, uninjected control. Scale bar, 200 µm. (h) The receptor kinase activity of ALK5 is required for its binding to Fscn1. ALK5 K232R is a kinase-defective mutant carrying a lysine to arginine substitution in the putative ATP-binding site. (i) Fscn1 has a higher affinity for ligand-activated type I receptors. HEK293 cells transfected with the indicated constructs were treated with or without 5 ng ml-l TGF-β1 or 25 ng ml-1 Activin A for 2 h before collecting for immunoprecipitation analysis. (j) HA-tagged ALK5 or ALK4 interacts with endogenous Fscn1. Note that the association of endogenous Fscn1 with HA-tagged ALK5 or ALK4 was enhanced in the presence of indicated ligands. The representative results of immunoprecipitation analysis were shown in c-e and h-j. Quantification is the mean relative ratio of co-immunoprecipitated signal over lysate (mean±s.d., at least three independent biological repeats). In all the immunoprecipitation analysis, HEK293T or HEK293 cells were cultured in 60 mm dishes. The dose of transfected plasmid DNA: ALK5-HA, 2 µg; CA-ALK5-HA, 2 µg; ALK5 KR-HA, 2 µg; ALK4-HA, 2 µg; CA-ALK4-HA, 2 µg; TβRII-HA, 1 µg; Myc-mFscn1, 1.5 µg; Myc-mFscn1 S39A, 1.5 µg; Myc-mFscn1 S39D, 1.5 µg. EXPRESSION / LABELING:
|
|
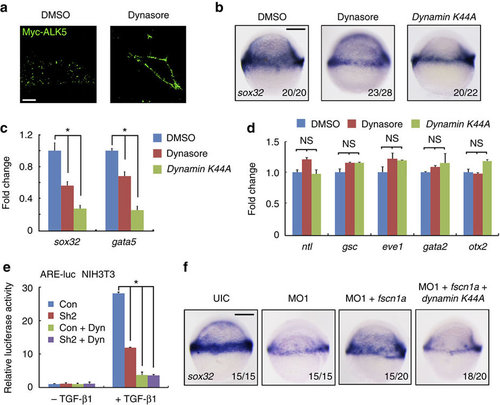
The functional connection between dynamin-dependent endocytosis and fscn1a during endoderm formation. (a) The inhibitory effect of dynasore on the endocytosis of membrane Myc-ALK5. NIH3T3 cells transfected with Myc-tagged ALK5 (1 µg in one well of six-well plate) were incubated with or without 80 µM dynasore for 30 min before antibody-labelled TGF-β type I receptor endocytosis assays. Then cells were incubated with anti-Myc antibody at 4 °C for 5 h, followed by incubation with PBS containing 10% knockout serum replacement (KSR) at 37 °C for 30 min. Dynasore were added during these incubation processes. The cells were visualized by immunofluorescence with anti-Myc (green) antibody. Scale bar, 5 µm. (b–d) The expression of sox32 and gata5 were assessed by in situ hybridization (b) and real-time PCR (c) at the shield stage in zebrafish embryos treated with 80 µM dynasore or injected with 400 pg of dynamin K44A mRNA. The expression of mesodermal (ntl, gsc and eve1), non-neural ectodermal (gata2) and neuroectodermal (otx2) markers were also examined by real-time PCR in these embryos (d). In c and d, the data are presented as mean±s.d. of three independent experiments. Student’s t-test, *P<0.05. NS, non-significant. The expression of β-actin was used as a reference to normalize the amount of mRNAs in each sample. (e) NIH3T3 cells transfected with the indicated plasmids were treated with or without TGF-β1 (5 ng ml-1) and dynasore (80 µM) for 12 h, and then collected for luciferase measurements. The relative luciferase activity was the mean with SD from three independent experiments. Student’s t-test, *P<0.05. (f) Inhibition of dynamin-dependent endocytosis impairs the fscn1a mRNA injection-induced rescue effects in fscn1a morphants. Embryos were co-injected with fscn1a MO1 and the indicated mRNAs at the one-cell stage and harvested at the shield stage for sox32 detection. |
|
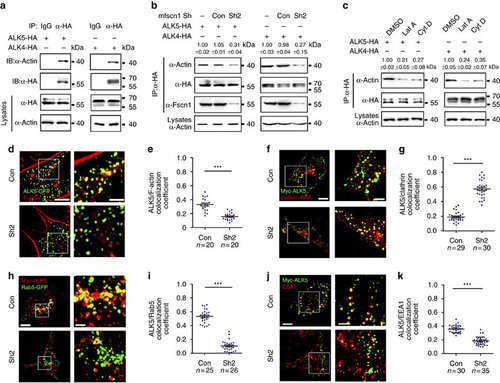
Downregulation of Fscn1 sequesters the internalized receptors in clathrin-coated vesicles. (a) Actin interacts with TGF-β family type I receptors. NMuMG cells were transfected with 8 µg indicated constructs per 100 mm dish, and then subjected to immunoprecipitation. (b) Fscn1 mediates the interaction of actin with TGF-β family type I receptors. Note that Fscn1-deletion markedly decreased the association of actin and ALK5 or ALK4. (c) NMuMG cells expressing HA-tagged ALK5 or ALK4 were treated with 1 µM Lat A or 2 µM Cyt D for 3 h, then collected for immunoprecipitation. In b and c, quantification is the mean relative ratio of co-immunoprecipitated signal over lysate (mean±s.d., three independent biological repeats). (d,e) NIH3T3 cells cotransfected with indicated plasmids were fixed and costained with phalloidin-TRITC and anti-GFP antibody to show the co-localization of F-actin (red) and ALK5 (green). The right images (Scale bar, 2 µm) were amplified from the boxed areas in the corresponding left images (Scale bar, 5 µm) (d). Peason’s co-localization coefficient was quantified from the indicated cell numbers in three independent experiments and the group values are expressed as mean±s.d. Student’s t-test, ***P<0.001 (e). (f-i) NIH3T3 cells were transfected with indicated plasmids and then subjected to antibody-labelled receptor endocytosis. Scale bar, (f) left images, 5 µm; right images, 2 µm. Scale bar, (h) left images, 5 µm; right images, 1 µm. Peason’s co-localization coefficient was quantified from the indicated cell numbers in three independent experiments and the group values are expressed as mean±s.d. Student’s t test, ***P<0.001 (g,i). (j,k) NIH3T3 cells expressing Myc-ALK5 and the indicated shRNAs were subjected to antibody-labelled receptor endocytosis. Scale bar,: left images, 5 µm; right images, 2 µm. Peason’s co-localization coefficient was quantified from the indicated cell numbers in three independent experiments and the group values are expressed as mean±s.d. Student’s t-test, ***P<0.001 (k). In the co-localization analysis, NIH3T3 cells were cultured in six-well plates. The dose of transfected plasmid DNA: ALK5-GFP, 0.5 µg; Myc-ALK5, 1 µg; shRNA2, 2 µg; Clathrin-RFP, 0.5 µg; Rab5-GFP, 0.5 µg. |
|
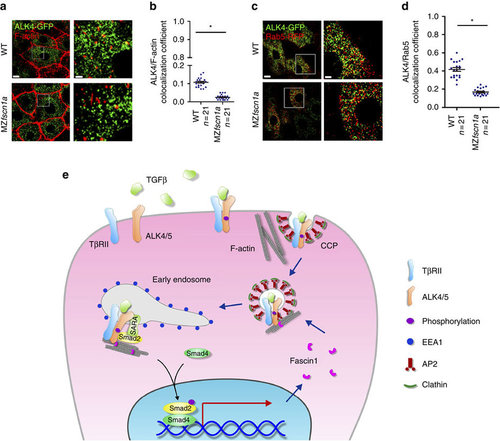
The endocytic trafficking defects of Activin/Nodal type I receptor ALK4 in MZfscn1a mutants. (a,b) 20 pg ALK4-GFP mRNA was injected into one blastomere of a 16-cell wild-type or MZfscn1a embryo. Embryos were harvested at shield stage and costained with phalloidin-TRITC and anti-GFP antibody to show the co-localization of F-actin (red) and ALK4 (green). GFP-positive hypoblast cells were selected and photoed using a Nikon A1R+ confocal microscope. The boxed area in the left image (Scale bar, 10 µm) is presented at a higher magnification in the corresponding right image (Scale bar, 2 µm) (a). Peason’s co-localization coefficient was quantified from the indicated cell numbers in three independent experiments and the group values are expressed as mean±s.d. Student’s t-test, *P<0.05 (b). (c) Immunostaining images of Rab5-RFP (red) and ALK4-GFP (green) in hypoblast cells of wild-type or MZfscn1a embryos. 20 pg ALK4-GFP mRNA and 20 pg Rab5-RFP mRNA were co-injected into one blastomere of a 16-cell wild-type or MZfscn1a embryo. Embryos were collected at shield stage for immunostaining with anti-GFP and anti-dsRed antibodies. Scale bar, left images, 10 µm; right images, 3 µm. (d) Peason’s co-localization coefficient of ALK4-GFP and Rab5-RFP was quantified from the indicated cell numbers in three independent experiments and the group values are expressed as mean±s.d. *P<0.05. (e) Proposed mechanism of the function of Fscn1 in trafficking and signalling of TGF-β type I receptors. TGF-β/Smad signal induces the expression of fscn1 gene and Fscn1 protein acting as a molecular linker between TGF-β family type I receptors and the actin cytoskeleton, which promotes the trafficking of internalized receptors from clathrin-coated vesicles to early endosomes, thereby enhancing TGF-β signal activity. TβRII, TGF-β type II receptor; CCP, clathrin-coated pit; AP2, assembly polypeptide 2. |
|
The spatiotemporal expression pattern of fscn1b during zebrafish embryogenesis. The expression of fscn1b in wild-type embryos was examined by in situ hybridization at indicated stages. Shield and 75%-epiboly stages, lateral views with dorsal to the right; 12 hpf, dorsal view with anterior to the top; 24 and 36 hpf, lateral views with anterior to the left. The arrow head shows that fscn1b transcript was expressed in specific neurons in the brain. Scale bar, 200 µm. |
|
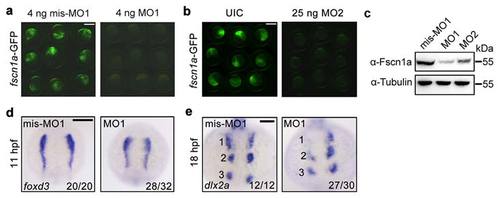
fscn1a morphants exhibit NC cell migration defects in the first stream. (a-b) Effectiveness of fscn1a MO1 and MO2. Embryos co-injected with 50 pg fscn1a-GFP plasmid DNA and indicated MOs. Green fluorescence was detected at the shield stage. fscn1a MO1 (a) or MO2 (b) injected embryos showed a noticeable decrease in green fluorescence when compared to control embryos. Scale bar, 400 µm. (c) The expression of fscn1a protein was examined by Western blots in shield-stage embryos injected with fscn1a MO1 (4 ng) or MO2 (25 ng). The expression of Tubulin was detected as loading control. (d-e) Embryos injected with mis-MO1 (4 ng) or fscn1a MO1 (4 ng) at the one-cell stage and harvested at indicated stages for in situ hybridization with foxd3 (d) and dlx2a (e) probes. Dorsal views with anterior to the top. Numbers were labeled to show the three streams of pharyngeal NC cells. Scale bar, 200 µm in panel d and 100 µm in panel e. EXPRESSION / LABELING:
PHENOTYPE:
|
|
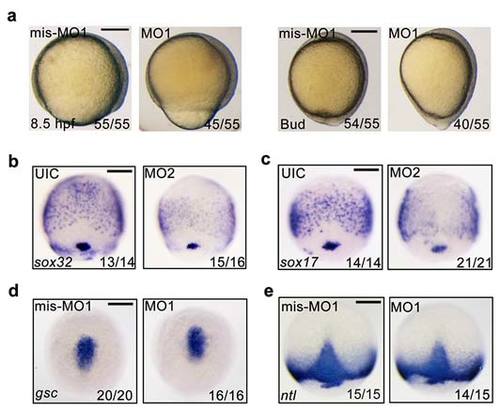
fscn1a morphants exhibit defects in epiboly progression and endoderm formation. (a) Representative bright-field images of 4 ng fscn1a mis-MO1 and MO1 injected embryos at 8.5 hpf and bud stages. Lateral views with dorsal to the right. (b-c) Knockdown of fscn1a by injection of 25 ng fscn1a MO2 dramatically reduced the expression of the early endodermal markers sox32 (b) and sox17 (c) at the 75% epiboly stage. Panels are shown in dorsal view with anterior to the top. (d-e) The expression of the mesendodermal markers is normal in fscn1a morphants. Embryos injected with mis-MO1 (4 ng) or fscn1a MO1 (4 ng) at the one-cell stage and harvested at the 75%-epiboly stage for in situ hybridization with gsc (d) and ntl (e) probes. Dorsal views with anterior to the top. Scale bar, 200 µm. EXPRESSION / LABELING:
PHENOTYPE:
|
|
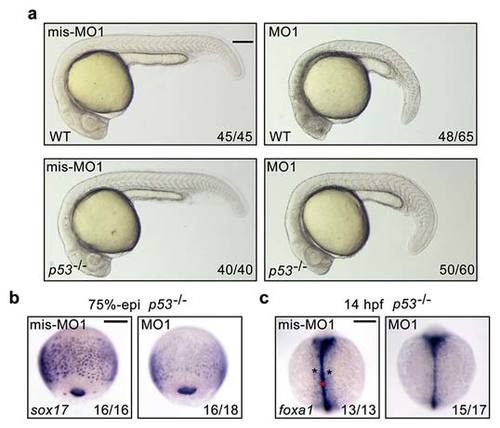
fscn1a knockdown in p53-/- mutants induce obvious defects in endoderm formation. (a) Representative bright-field images of wild-type and p53-/- mutant embryos injected with 4 ng fscn1a mis-MO1 or MO1 at 24 hpf. Lateral views with dorsal to the right. Scale bar, 200 µm. (b-c) The expression of endodermal markers in p53-/- mutant embryos at 75%-epiboly stage (b) and 14 hpf (c). (b) Lateral views with dorsal to the right. Scale bar, 200 µm. |
|
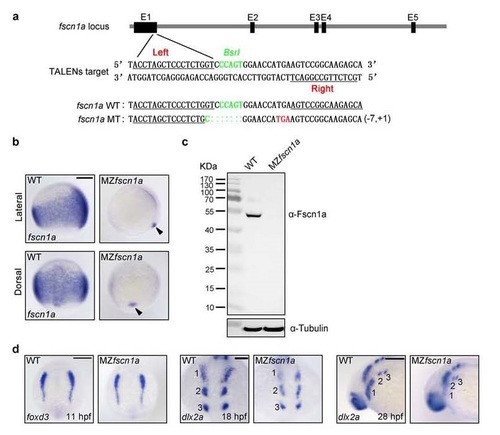
MZfscn1a mutants display migration defects in the first NC stream. (a) Generation of fscn1a mutant with TALENs. The “Left” and “Right” binding sites for TALENs were underlined and the BSRI site was shown in green used for detection of mutations by restriction enzyme digestion. One mutation which led to a shift of the open reading frame with a premature stop codon (red) was identified from the F1 embryos of founder fish. (b-c) The expression of fscn1a mRNA and protein in wild-type and MZfscn1a mutant embryos. Wild-type and MZfscn1a mutant embryos were harvested at the 75%-epiboly stage for in situ hybridization (b) and immunoblotting (c). Note that the forerunner cell expression of fscn1a transcripts is not changed in MZfscn1a mutants (b, indicated by arrow head). Scale bar, 200 µm. (d) Wild-type and MZfscn1a mutant embryos were harvested at 11 hpf (Scale bar, 200 µm), 18 hpf (Scale bar, 100 µm) and 28 hpf (Scale bar, 200 µm) for in situ hybridization with foxd3 and dlx2a probes. Note that MZfscn1a mutants have normal NC induction but decreased number of dlx2a-expressing NC cells in the first stream. EXPRESSION / LABELING:
PHENOTYPE:
|
|
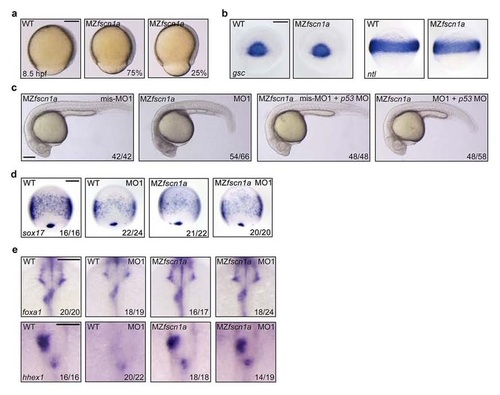
MZfscn1a mutants exhibit defects in epiboly progression and endoderm development, but have normal mesoderm formation. (a) Representative bright-field images of wild-type and MZfscn1a mutants at 8.5 hpf. The percentage of MZfscn1a mutants with various degrees of epiboly defects was shown. Scale bar, 200 µm. (b) Wild-type and MZfscn1a mutant embryos were harvested at the shield stage for in situ hybridization with gsc and ntl probes. Scale bar, 200 µm. (c) Representative bright-field images of MZfscn1a mutant embryos injected with indicated 4 ng fscn1a MOs together with or without 4 ng p53 MO at 24 hpf. Scale bar, 200 µm. (d) The expression of sox17 at 75% epiboly stage was examined in wild-type and MZfscn1a mutant embryos injected with indicated fscn1a MOs. Note that no visible enhancement of endodermal related defects was observed in MO1 injected MZfscn1a embryos compared with uninjected mutants. Scale bar, 200 µm. (e) The expression of foxa1 and hhex1 at 28 hpf was examined in wild-type and MZfscn1a mutant embryos injected with indicated fscn1a MOs. Note that the liver and pancreatic buds were normally formed in MO1 injected MZfscn1a embryos compared with uninjected mutants. Scale bar, 200 µm in the upper panels and 100 µm in the lower panels. EXPRESSION / LABELING:
PHENOTYPE:
|
|
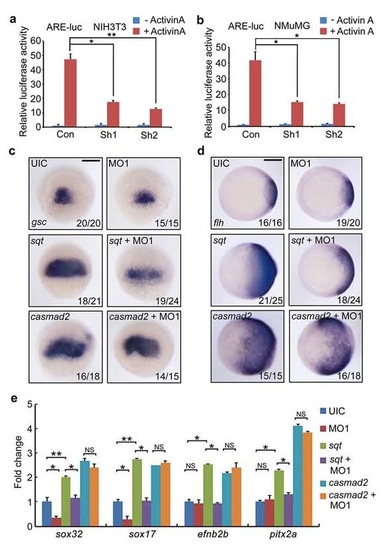
Knockdown of Fscn1a impairs sqt ectopic expression-induced exression of target genes. (a-b) mammalian Fscn1 is required for Activin signal transduction. NIH3T3 (a) and NMuMG (b) cells transfected with the indicated plasmids (2 µg shRNA plasmids together with or without 0.5 µg reporter plasmids in one well of 6-well plate) were treated with Activin A (25 ng/ml) for 12 hours before harvested for luciferase measurements. The relative luciferase activity was the mean with SD from three independent experiments. Student’s t test, *P < 0.05, **P < 0.01. (c-e) fscn1a is essential for Nodal signal to regulate target gene expression. Wild-type embryos were injected with indicated MOs and mRNAs and harvested at shield stage for in situ hybridization (c and d) and real-time PCR experiments (e). Note that the sqt overexpression induced- but not casmad2 overexpression induced-expression of Nodal signal target genes was inhibited by fscn1a MO1 injection. Scale bar, 200 µm. In panel e, the expression of β-actin was used as a reference to normalize the amount of mRNAs in each sample. The data are presented as mean ±SD of three independent experiments. Student’s t test, *P < 0.05, **P < 0.01; NS, nonsignificant. UIC, uninjected control. |
|
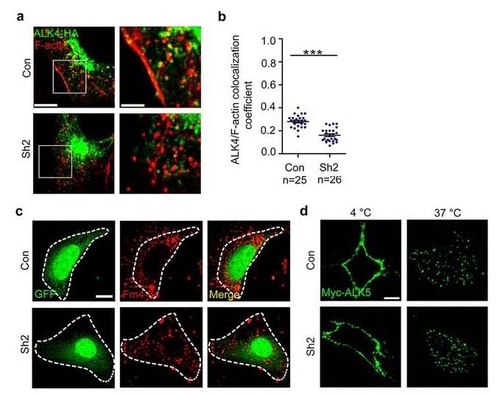
Fscn1-deletion interferes with the co-localization of ALK4 and F-actin, but does not affect the internalization of type I receptors. (a-b) NIH3T3 cells cotransfected with ALK4-HA and shRNA plasmids were fixed and costained with phalloidin-TRITC and anti-HA antibody to show the colocalization of F-actin (red) and ALK4 (green). The boxed area in the left image (Scale bar, 5 µm) is presented at a higher magnification in the corresponding right image (Scale bar, 2 µm) (a). Peason’s colocalization coefficient was quantified from the indicated cell numbers in three independent experiments and the group values are expressed as mean±SD. Student’s t test, ***P < 0.001 (b). (c) Representative fluorescence micrographs from experiments examining the uptake of FM4-64-labeled plasma membrane in NIH3T3 cells. NIH3T3 cells transfected with the indicated shRNA plasmids with a GFP marker were incubated with FM4-64 for 1 hour, fixed, and imaged using Nikon A1R+ confocal microscope system. Scale bar, 5 µm. (d) NIH3T3 cells expressing Myc-tagged ALK5 were incubated with mouse anti-Myc antibody at 4 °C for 5 h then incubated with PBS containing 10% FBS at 37 °C for 30 min. The cells were visualized by immunofluorescence with anti-Myc (green). Scale bar, 5 µm. In the colocalization analysis, NIH3T3 cells were cultured in 6-well plates. The dose of transfected plasmid DNA: Myc-ALK5, 1 µg; ALK4-GFP, 0.5 µg. |

