- Title
-
Neuronal Connectivity between Habenular Glutamate-Kisspeptin1 Co-expressing Neurons and the Raphe 5-HT System
- Authors
- Nathan, F.M., Ogawa, S., Parhar, I.S.
- Source
- Full text @ J. Neurochem.
|
Kisspeptin 1 (Kiss1) projection in the zebrafish brain. (a–c) Kiss1-immunoreactive cells observed in the vHb (a) project through the fasciculus retroflexus (FR) (b) down to the vaMR (c). (d and e), Photomicrograph of sagittal section of Tg brn3a zebrafish expressing green fluorescent protein (GFP) in dHbM-vIPN pathway. (f–i) Kiss1-immunoreactive cells noted in vHb (red) and not in the dHb (green) with axonal projections coursing through the FR and terminating at the vaMR, a structure following the GFP-expressing vIPN. (j) Illustration depicts projections of dHbM and vHb through the FR to the vIPN and vaMR (a subregion of the MR) respectively as a representation of the sagittal images. Scale bars, 100 µm. |
|
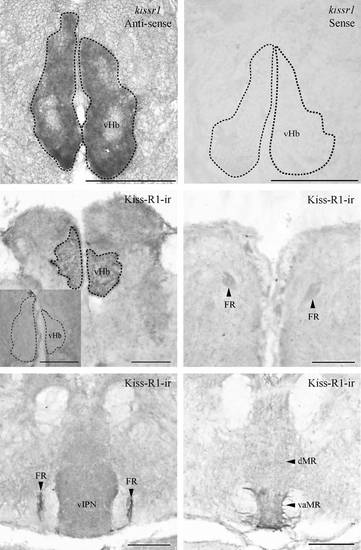
Expression of kissr1 mRNA and Kiss-R1 projection in the zebrafish brain. Coronal sections where kissr1 mRNA is noted in the ventral subnuclei of the habenula (a) and no cells were observed in the sense strand (b). Kiss-R1-immunoreactive (-ir) cells observed in the vHb (c) send projections through the fasciculus retroflexus (FR) (d and e) down to the vaMR (f). Preabsorption with antigen showed no Kiss-R1–ir fibers or cells (C inset). Scale bars, 100 µm. |
|
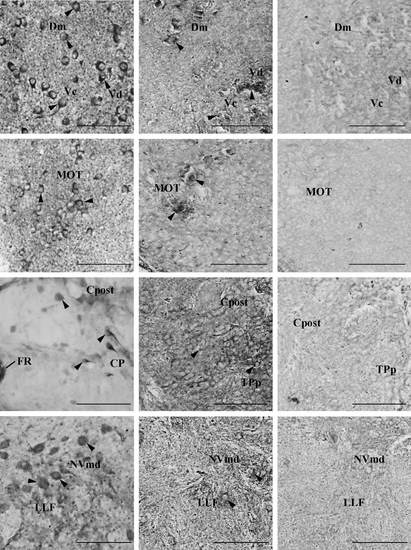
Kiss-R1-ir localization and kissr1b-derived protein 2 (KRBDP2) expression in other regions of the zebrafish brain. a1–d1, Kiss-R1-immunoreactive (-ir) cell somata observed outside of the habenula such as the forebrain (a and b), midbrain (c) and hindbrain (d) regions. a2–d2, KRBDP2 mRNA expression was also observed in same regions as Kiss-R1-ir cells. a3–d3, The sense riboprobe showed no expression of KRBDP2 mRNA. For abbreviations, see (Table 2). Scale bars, 100 µm. |
|
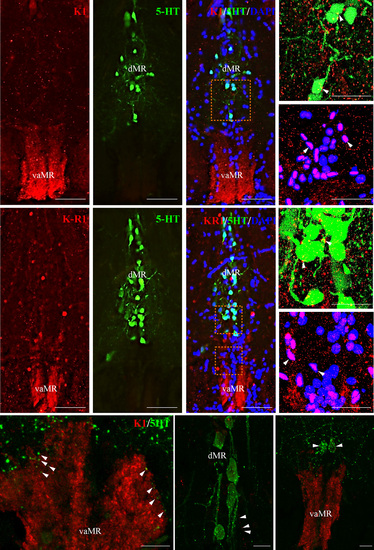
Neural association of kisspeptin 1 (Kiss1) and Kiss-R1 fibers (red) with serotonergic (green) and non-serotonergic (blue) raphe neurons in pet1 Tg zebrafish. (a–c) and F-H: Kiss1 (a–c) and Kiss-R1 (f–h) fiber terminal was seen in the vaMR, while pet1-green fluorescent protein (GFP) labeled 5-HT neurons were noted in the MR. (d, e, i and j) Confocal image of double-labeling showed close association of Kiss1 (d and e) and Kiss-R1 (i and j) fibers with 5-HT neurons in the dMR (d and i) and non-5-HT cells (DAPI) in the vaMR (e and j). There was no co-expression of Kiss-R1 in 5-HT cells. (60× plus 1.5× optical zoom; N.A. = 1.4; z-step = 0.15 µm). (k–m) 5-HT fibers were seen in close association with Kiss1 fibers in the vaMR (k) and in the dMR (l). There were few 5-HT cells seen near the vaMR region, but not inside the vMR (m). Scale bars, (a–c) and (f–g) 100 µm; (d, e, i and j) 20 µm; (k–m) 10 µm. |
|
Dual-fluorescence labeling of kisspeptin 1 (Kiss1) and Kiss-R1 (red) in glutamatergic and GABAergic neurons (green) in the habenula. (a–c) Photomicrographs showing some populations of Kiss1-immunoreactive (-ir) cells in the vHb that co-localized with cells expressing slc17a6b mRNA. Some individual Kiss1-ir fibers originating from the vHb co-localized with slc17a6b mRNA (as seen in the magnified confocal inset representing the region enclosed by the orange-dotted box; 60× plus 1.5× optical zoom; N.A. = 1.4; z-step = 0.15 µm). No co-localization was observed between Kiss1-ir cells and gad2 mRNA-expressing cells. A: anterior thalamic nucleus. Scale bars, (a–f) 100 µm and inset c and f: 50 µm. |
|
Dual-fluorescence labeling of kisspeptin 1 (Kiss1) (red) in glutamatergic and GABAergic neurons (green) in raphe nuclei. (a–c) In the raphe nuclei, Kiss1-immunoreactive (-ir) fibers were seen in close association with slc17a6b mRNA expressing neurons in the dMR as denoted by the confocal image (inset C). (d–f) green fluorescent protein (GFP)-labeled Gad1b neurons were observed only in the dMR with no close associations observed with Kiss1-ir fibers. G-I: Kiss1-ir fibers were seen in close association with gad2 mRNA expressing neurons in the dMR, denoted by the confocal image (inset I; 60× plus 1.5× optical zoom; N.A. = 1.4; z-step = 0.15 µm). Presence of actual space of at least 0.15 µm noted between fibers and cells. Scale bars, (a–i): 100 µm; inset C and I: 50 µm. |
|
Kiss-R1-ir localization and KRBDP2 expression in other regions of the zebrafish brain. A1-D1, Kiss-R1-immunoreactive (-ir) cell somata observed outside of the habenula such as the dorsal telencephalic area (A1), central, medial (B1) and posterior (C1) zone of dorsal telencephalic area, postcommissural nucleus of ventral of the ventral telencephalic area (B1), inner arcuate nucleus and intermediate reticular formation (D1). A2-D2, KRBDP2 mRNA expression was also observed in same regions as Kiss-R1-ir cells. A3-D3, The sense riboprobe showed no expression of KRBDP2 mRNA. For abbreviations, see Table 2. Scale bars, 100 µm. |
|
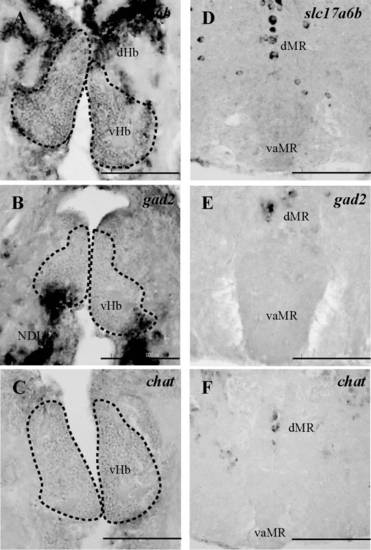
Expression of slc17a6b, gad2 and chat mRNAs in the habenula and raphe regions. A and D, slc17a6b mRNA was noted in some population of cells in the vHb and in the dMR and sparsely in the DR. B and E, gad2 mRNA expressing cells was observed as a minute population in the ventral region of the vHb and in the dMR. C and F, chat mRNA was weakly present in the vHb with some cells in the dMR and DR. Scale bars, 100 µm. |
|
Dual-fluorescence labeling of Kiss-R1 (red) in glutamatergic and GABAergic neurons (green) in raphe nuclei. A-C: Kiss-R1-immunoreactivity co-expressed with slc17a6b-expressing cells as denoted by the confocal image (inset C; 79.8X; N.A. = 1.4; z-step 0.15 µm). D-F: GFP-labeled Gad1b neurons were only observed in the dMR with no close associations observed with Kiss-R1 fibers. G-I: There was no co-localization of Kiss-R1 with gad2- expressing cells, but Kiss-R1-ir fibers were noted within close proximity in the dMR. Presence of actual space of at least 0.15 µm noted between fibers and cells (inset I). Scale bars, A-F: 100 µm and inset C and I: 50 µm. |
|
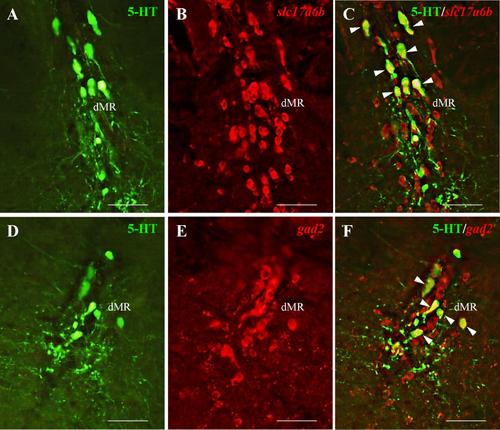
Co-expression of slc17a6b and gad2 (red) with 5-HT (green). In the raphe nuclei, some 5-HT neurons co-express both slc17a6b (A-C) and gad2 (D-F). Scale bars, 100 µm. |


