Fig. S1
|
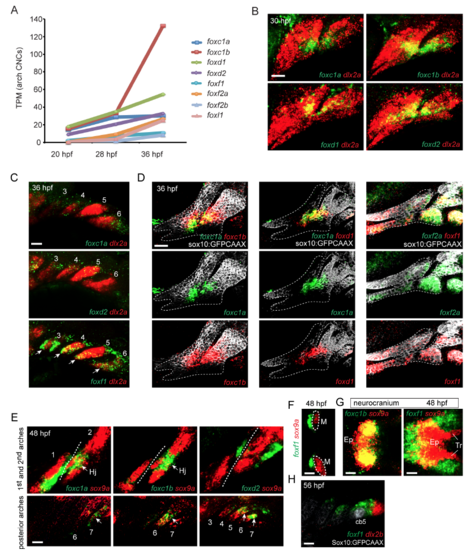
Arch expression of Fox genes (A) Transcripts Per Million Reads (TPM) values for Fox genes in FACS-purified arch CNCs at 20, 28, and 36 hpf. (B) Fluorescent in situ hybridizations at 30 hpf show similar expression of foxc1a, foxc1b, foxd1, and foxd2 (green) in dlx2a+ CNCs (red) of the first two arches. (C) Fluorescent in situ hybridizations at 36 hpf show expression of foxf1 in the ventral domains (arrows) of the gill-bearing branchial arches (numbered 3-6), but only minimal expression of foxc1a and foxd2. (D) Double fluorescent in situ hybridizations at 36 hpf show relative expression of foxc1a (green) to foxc1b (red) and foxd1 (red), and foxf1 (red) to foxf2a (green), in Sox10:GFPCAAX+ CNCs (white) of the first two arches (dotted lines). foxc1b is more broadly expressed than foxc1a and foxd1. foxf1 and foxf2a are expressed in largely similar domains. (E-F) Fluorescent in situ hybridizations show expression of foxc1a, foxc1b, foxd2, and foxf1 (green) relative to sox9a+ chondrocytes (red) at 48 hpf. By this stage, Fox gene expression is generally excluded from early cartilage, including around the distal tip of Meckel’s (M), although expression of foxc1a and foxc1b is observed in nascent sox9a+ chondrocytes of the hyoid joint (Hj, arrows). We also observe expression of foxc1b and foxd2 in intermediate and dorsal domains (arrows), respectively, of the posterior arches, and weak expression of foxc1a in the seventh arch (arrow). (G) In the developing neurocranium, foxc1b co-localizes with sox9a, while foxf1 is seen in cells surrounding the trabeculae (Tr) and ethmoid plate (Ep). (H) Confocal section shows expression of foxf1 (green) in the dental mesenchyme adjacent to the dlx2b+ dental epithelium (red) and the sox10:GFPCAAX+ ceratobranchial cartilage 5 (cb5, labeled in white by anti-GFP antibody). Scale bars = 25 μm. |

