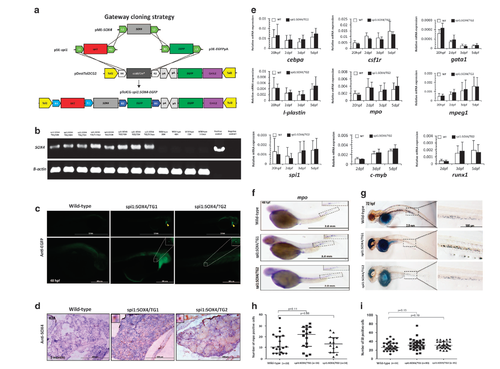
Generation and characterization of the Tg(spi1:SOX4-EGFP) transgenic zebrafish. (a) Schematic diagram showing the LR recombination reaction used to generate the expression constructs, including three entry clones (p5E-spi1, pME-SOX4 and p3E-EGFPpA) and a destination vector (pDestTol2CG2) that contains the cmlc2:EGFP-pA expression cassette. The final construct (pTolCG-spi1:SOX4-EGFP) is shown at the bottom of the figure. (b) Results of semiquantitative PCR showing the expression of SOX4 in TGs and wild-type embryos at 20, 48 and 72 h post fertilization (HPF) and at 5 days. Negative control: non-template; Positive control: pTolCG-spi1:SOX4-EGFP plasmid. (c) Whole-mount immunohistochemical staining (IHC) showed EGFP-positive cells in the heart (yellow arrow) as well as around the yolk sac and caudal hematopoietic tissue (CHT) at 48 HPF. The panel shows GFP+ cells at a higher magnification. (d) Tissue sections showing SOX4-positive cells in the KM of Tg(spi1:SOX4-EGFP) fish but not in those of wild-type fish. The panel shows SOX4-positive cells at a higher magnification. (e) Results from quantitative reverse transcription-PCR (RT-PCR) analysis of hematopoietic marker genes in SOX4 transgenic zebrafish embryos and in wild-type fish embryos. Data are presented as the mean±s.e.m. from three independent experiments. (f, g) Results from whole-mount in situ hybridization (WISH) of mpo and Sudan black (SB) staining showing mpo-positive cells in CHT at 48 HPF and SB-positive cells in CHT at 72 HPF, respectively (magnification: × 40). The panel shows positive cells at a higher magnification (× 100), respectively. Quantification of mpo-positive cells (h) and SB-positive cells (i). Differences among variables were assessed using Student’s t-test.
|

