- Title
-
Localisation and function of key axonemal microtubule inner proteins and dynein docking complex members reveal extensive diversity among vertebrate motile cilia
- Authors
- Lu, H., Twan, W.K., Ikawa, Y., Khare, V., Mukherjee, I., Schou, K.B., Chua, K.X., Aqasha, A., Chakrabarti, S., Hamada, H., Roy, S.
- Source
- Full text @ Development
|
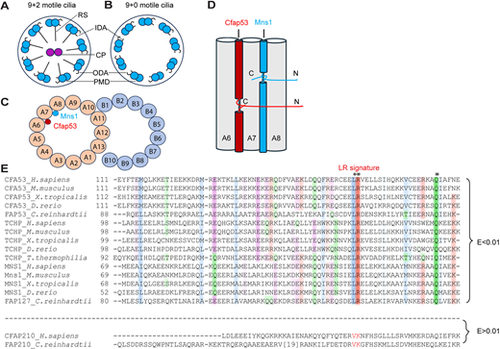
Motile cilia structure, CFAP53 and MNS1 protein disposition within the A tubule and their paralogous nature. (A,B) Diagram of (9+2) (A) and (9+0) motile cilia (B). The peripheral microtubule doublet (PMD), central pair (CP), inner dynein arm (ID), outer dynein arm (OD) and radial spoke (RS) are indicated. (C) Diagrammatic transverse section through the PMD, showing MNS1 and CFAP53 localisation within the A tubule. (D) Diagrammatic longitudinal section through the A tubule (microtubule protofilaments A6-A8), illustrating CFAP53 and MNS1 arrangement. C, C terminus; N, N terminus. (E) MSA of fMIP family members bearing the LRQ motif. Asterisks indicate invariably conserved residues. Proteins are designated by their UniProt identifiers. Colouring schemes are as per ClustalX parameters. Species represented are Homo sapiens, Mus musculus, Xenopus tropicalis, Danio rerio, Tetrahymena thermophilia and Chlamydomonas reinhardtii. |
|
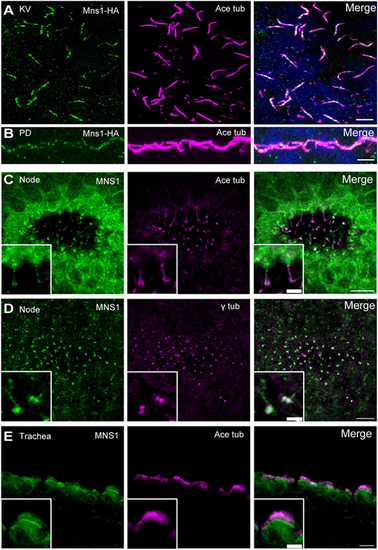
MNS1 localisation to motile cilia in zebrafish and mouse tissues. (A) Immunofluorescence with antibodies to HA epitope (green) and acetylated tubulin (magenta) of cilia in zebrafish KV [10-somite stage (14 hpf)]. (B) Immunofluorescence with antibodies to HA (green) and acetylated tubulin (magenta) of zebrafish pronephric duct (PD) cilia (24 hpf). (C) Immunofluorescence with antibodies to MNS1 (green) and acetylated tubulin (magenta) of E8.0 mouse node cilia. (D) Immunofluorescence with antibodies to MNS1 (green) and γ tubulin (magenta) of E8.0 mouse node cilia. (E) Immunofluorescence with antibodies to MNS1 (green) and acetylated tubulin (magenta) of adult mouse trachea. Insets in C-E show higher magnification views. Scale bars: 5 µm (A,B,E, main panel); 2 µm (C,D, main panels); 10 µm (C-E, insets). |
|
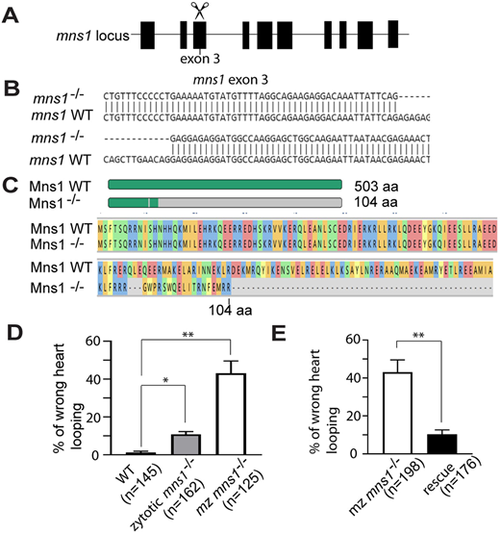
mns1 mutant zebrafish and L-R asymmetry defects. (A) Schematic of the zebrafish mns1 locus and targeting of exon 3 with guide RNA. (B) Nucleotide sequence of the mns1 mutant allele compared with wild type. (C) Schematic and amino acid sequence of the predicted Mns1 mutant protein compared with wild type. (D) Percentage of embryos (48 hpf) showing a heart looping defect compared with wild type (three technical replicates). (E) Percentage of mns1 mutant embryos (48 hpf) showing a heart looping defect after rescue with mns1-HA mRNA, compared with uninjected mns1 mutant embryos (three technical replicates). Data are presented as mean±s.d. *P≤0.05, **P≤0.01 (two-tailed Student's t-test). |
|
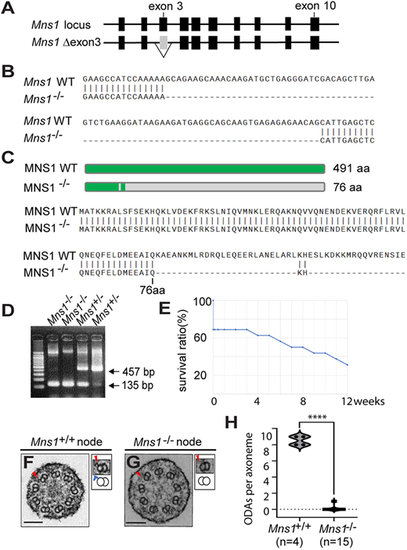
ODA loss from Mns1 mutant mouse (9+0) nodal cilia. (A) Genetic structure of the wild-type Mns1 locus and generation of the knockout allele lacking exon 3. (B) Nucleotide sequence of the Mns1 mutant allele compared with wild type. (C) Schematic and amino acid sequence of the predicted MNS1 mutant protein compared with wild type. (D) PCR-based genotyping of Mns1−/− mice. (E) Survival curve of Mns1−/− mice. Mice analysed were 0-12 weeks of age, without sex bias. (F,G) TEM analysis of wild-type and Mns1–/– node cilia. Higher-magnification views of corresponding doublet microtubules (arrowheads), together with schematic diagrams of PMDs and ODAs (blue protrusions) are shown. Scale bars: 100 nm. (H) ODA number per node cilium from wild-type and Mns1−/− embryos. Data are presented as a violin plot. ****P≤0.0001 (two-tailed Student's t-test). |
|
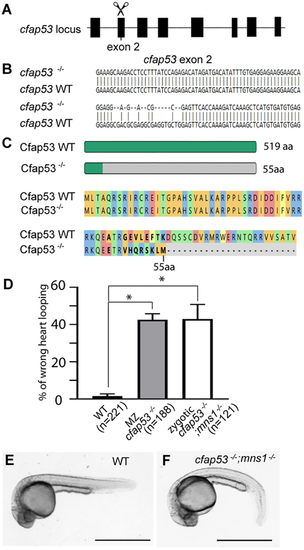
Severe ciliary disorder in zebrafish cfap53; mns1 double mutants. (A) Schematic of the zebrafish cfap53 locus and targeting of exon 2 with guide RNA. (B) Nucleotide sequence of the cfap53 mutant allele compared with wild type. (C) Schematic and amino acid sequence of the predicted Cfap53 mutant protein compared with wild type. (D) Percentage of embryos showing a heart looping defect (48 hpf) compared with wild type (three technical replicates). Data are presented as mean±s.d. *P≤0.05 (two-tailed Student's t-test). (E) Wild-type (WT) zebrafish embryo morphology (24 hpf). (F) A cfap53−/−; mns1−/− double mutant embryo with curved body axis (24 hpf). Scale bars: 1 mm. |
|
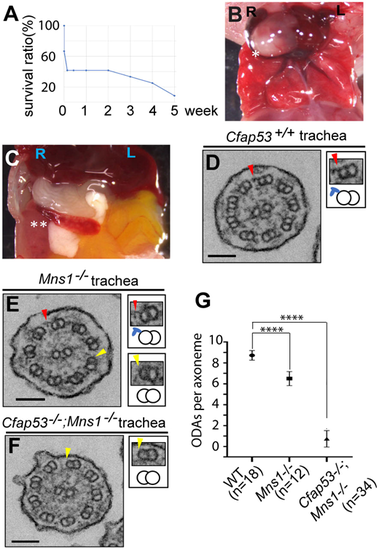
ODA loss from Cfap53; Mns1 double mutant mouse (9+2) tracheal cilia. (A) Survival curve of Cfap53−/−; Mns1−/− double mutants. Mice analysed were 0-5 weeks of age, without sex bias. (B,C) Laterality defects of Cfap53−/−; Mns1−/− mice: heart apex (asterisk) in reversed (dextral) position (B), and spleen (double asterisk) in reversed (dextral) position (C). (D-F) Tracheal cilia TEM analysis from Cfap53+/+ (D), Mns1–/– (E) and Cfap53–/–; Mns1−/− mice (F). Insets show higher-magnification views of PMDs (arrowheads), together with their schematics including the ODAs (blue protrusions). Scale bars: 100 nm. (G) ODA number per tracheal cilium from wild-type control, Mns1−/− and Cfap53−/−; Mns1−/− mice. Data are presented as mean±s.d. ****P≤0.0001 (two-tailed Student's t-test). |
|
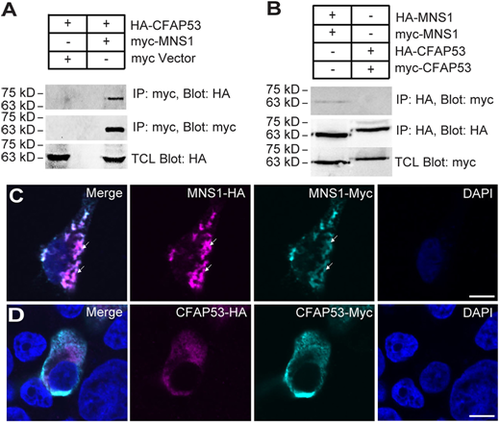
Biochemical interaction between MNS1 and CFAP53. (A) Myc-tagged MNS1 immunoprecipitated with HA-tagged CFAP53. (B) MNS1, but not CFAP53, exhibited self-interaction. (C) MNS1-Myc and MNS1-HA formed filament-like structures in HEK293T cells (arrows). MNS1-HA was stained with anti-HA antibody (magenta); MNS1-Myc was stained with anti-Myc antibody (cyan). (D) CFAP53-Myc and CFAP53-HA showed diffuse staining in HEK293T cells. CFAP53-HA was stained with anti-HA antibody (magenta); CFAP53-Myc was stained with anti-Myc antibody (Cyan). Scale bars: 5 µm. Immunoprecipitation was verified with two biological replicates. Immunofluoresence data represent two technical replicates with 100 cells analysed per replicate. |
|
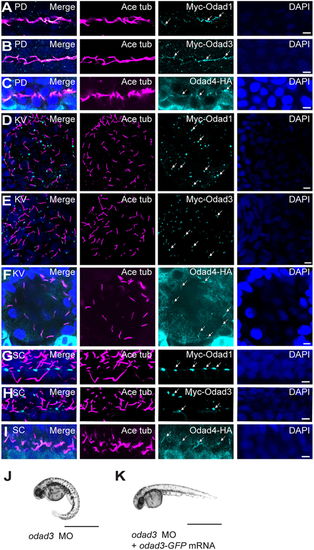
Differential localisation of Odad proteins to zebrafish motile cilia axonemes and basal bodies. (A-C) Odad1, Odad3 and Odad4 localised along axonemes of (9+2) cilia in zebrafish pronephric duct (PD) at 24 hpf. (D,E) Odad1 and Odad3 localised to KV cilia base at the 10-somite stage. (F) Odad4 localised along axonemes of KV cilia. (G,H) Odad1 and Odad3 localised at the spinal canal (SC) cilia base at 24 hpf. (I) Odad4 localised along axonemes of SC cilia at 24 hpf. Odad proteins were detected with anti-Myc antibody (for Odad1 and Odad3; cyan, arrows) or anti-HA antibody (for Odad4; cyan, arrows), cilia with anti-acetylated tubulin antibody (magenta) and nuclei with DAPI (blue). (J) An odad3 morphant (MO) (48 hpf), showing a ventrally curved body axis. (K) An odad3 morphant (MO) (48 hpf), with rescue of axial curvature on co-injection of odad3-gfp mRNA. Data represent three technical replicates with n=75 per replicate. Scale bars: 5 µm (A-I); 1 mm (J,K). |

