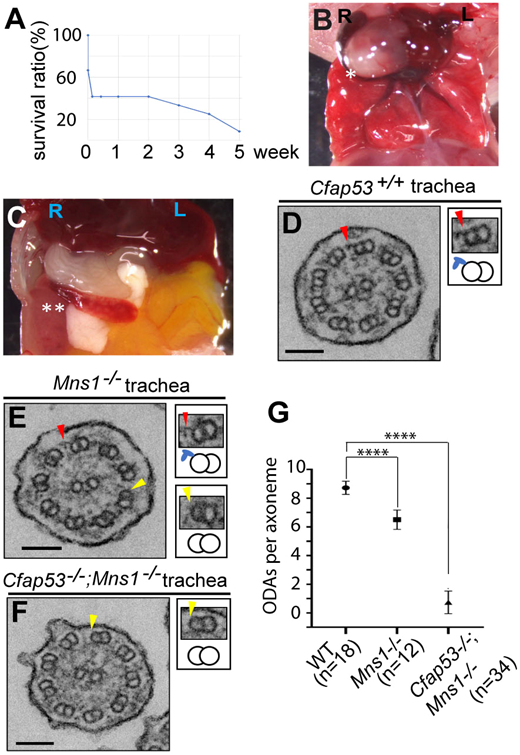
Fig. 6 ODA loss from Cfap53; Mns1 double mutant mouse (9+2) tracheal cilia. (A) Survival curve of Cfap53−/−; Mns1−/− double mutants. Mice analysed were 0-5 weeks of age, without sex bias. (B,C) Laterality defects of Cfap53−/−; Mns1−/− mice: heart apex (asterisk) in reversed (dextral) position (B), and spleen (double asterisk) in reversed (dextral) position (C). (D-F) Tracheal cilia TEM analysis from Cfap53+/+ (D), Mns1–/– (E) and Cfap53–/–; Mns1−/− mice (F). Insets show higher-magnification views of PMDs (arrowheads), together with their schematics including the ODAs (blue protrusions). Scale bars: 100 nm. (G) ODA number per tracheal cilium from wild-type control, Mns1−/− and Cfap53−/−; Mns1−/− mice. Data are presented as mean±s.d. ****P≤0.0001 (two-tailed Student's t-test).
Image
Figure Caption
Acknowledgments
This image is the copyrighted work of the attributed author or publisher, and
ZFIN has permission only to display this image to its users.
Additional permissions should be obtained from the applicable author or publisher of the image.
Full text @ Development

