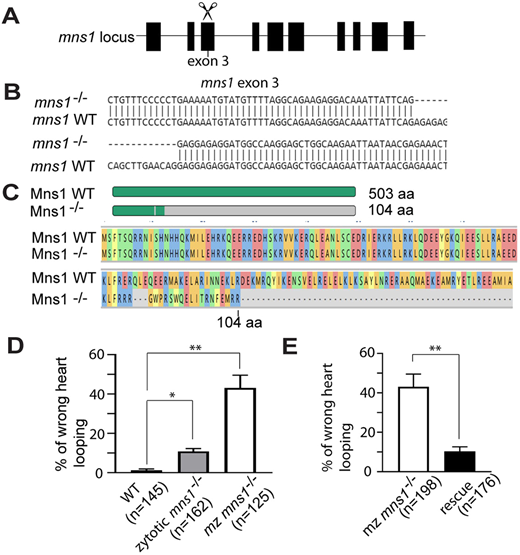
Fig. 3 mns1 mutant zebrafish and L-R asymmetry defects. (A) Schematic of the zebrafish mns1 locus and targeting of exon 3 with guide RNA. (B) Nucleotide sequence of the mns1 mutant allele compared with wild type. (C) Schematic and amino acid sequence of the predicted Mns1 mutant protein compared with wild type. (D) Percentage of embryos (48 hpf) showing a heart looping defect compared with wild type (three technical replicates). (E) Percentage of mns1 mutant embryos (48 hpf) showing a heart looping defect after rescue with mns1-HA mRNA, compared with uninjected mns1 mutant embryos (three technical replicates). Data are presented as mean±s.d. *P≤0.05, **P≤0.01 (two-tailed Student's t-test).
Image
Figure Caption
Acknowledgments
This image is the copyrighted work of the attributed author or publisher, and
ZFIN has permission only to display this image to its users.
Additional permissions should be obtained from the applicable author or publisher of the image.
Full text @ Development

