FIGURE SUMMARY
Title

Stochastic gene expression and environmental stressors trigger variable somite segmentation phenotypes

Authors
Keseroglu, K., Zinani, O.Q.H., Keskin, S., Seawall, H., Alpay, E.E., Özbudak, E.M.
Source
Full text @ Nat. Commun.

Segmentation defects in mutants are stochastic.

a Her1-Her1 and Her7-Hes6 dimers form a negative feedback loop by repressing their own transcription. b Somite boundaries are marked by xirp2 ISH staining in sibling her1ci302 mutant embryos. While the upper embryo has no segmentation defect, lower embryo has 6 defective segmentation boundaries (marked by the star). Insets show 500-µm-wide enlarged images of boundaries. Scale bar is 300 µm. c, d Percentage of her1ci302 mutants displaying wild-type phenotype (striped) or segmentation defects (dotted) at 28 °C (c, n = 50, N = 15), and number of defective boundaries per each side of her1ci302 mutants (d, n = 100, N = 15). The violin plot shows the median (thick black line) and quartiles (thin black lines). exirp2 ISH staining of her7hu2526 mutants. Insets show 500-µm-wide enlarged images of boundaries. Scale bar is 300 µm. f Scoring of segmentation defect position of one her7hu2526 mutant embryo raised at 28 °C. g The Pearson correlation of same side consecutive somite phenotype (n = 222, N = 3), and (h) same position left- and right-side somite phenotype (n = 111, N = 3) between 11th and 30th somite boundaries. n is the number of embryos in (c, h), and sides in (d, g); N is the number of fish pairs in (c, d), and number of independent experiments in (g, h). Source data are provided as a Source Data file.

Gene expression in mutants are stochastic.

ac smFISH was performed at 12–14 somite stage to count her1 (cyan) and her7 (red) transcription in wild-type (a), her1ci302 (b), and her7hu2526 (c) embryos raised at 23 °C. Scale bar is 100 µm. Yellow stars mark her1 and her7 genes carrying point mutations causing premature stop codons. d The spatial Pearson correlation scores of her1 and her7 in wild-type (dark gray, n = 31, N = 3), her1ci302 (gray, n = 14, N = 2), and her7hu2526 (light gray, n = 29, N = 2) embryos. *P = 0.0157 (wild-type versus her1ci302), ****P = 0.2146 × 10−5 (wild-type versus her7hu2526), P = 0.7243 (her1ci302 versus her7hu2526), Kruskal–Wallis ANOVA with Dunn’s multiple-comparison correction. ns, not significant. Black lines show the mean of data in the scatter dot plot. n is the number of embryos; N is the number of independent experiments. Source data are provided as a Source Data file.

An amplitude threshold of oscillations is required for successful segmentation in a genetic background displaying variable expressivity.

ac Brightfield images of her1ci301;her7hu2526;her1-Venus+/-;her7-Venus+/- embryos with variable expressivity. Representative embryos are ordered by their increasing number of defective somites (ac). Stars show defected boundaries between 11th and 25th somite boundaries. d Number of defected boundaries per one side of each embryo (n = 41, N = 3). Black lines show median (thick), and quartiles (thin). e Brightfield and Venus images of a single embryo at 70, 150, and 440 min. Yellow, red and green lines show line-of-interest (LOI) borders in Venus channel at each time point. Star shows a defected boundary. f A representative kymograph of Venus signal seen in (e) between 7 and 25 somite stages (for 600 min, y-axis) along the entire PSM (x-axis, posterior-aligned to the left). Blue solid line shows determination front position. Star shows where and when the 15th boundary (defected) is determined, and white dash shows when it is formed. g Smoothened line profile of Venus signal along determination front position (arbitrary units, arb. units). Blue star shows the wave determining the defected boundary. h Normalized amplitude of waves for intact (striped, n = 283, N = 3) and defected (dotted, n = 328, N = 3) boundaries. ****P = 0.4908 × 10−8, two-tailed Mann–Whitney U-test. The whisker plot shows the median (line), quartiles (box), as well as the 10th and 90th percentiles (whiskers). n is the number of embryos in (d), and boundaries in (h); N is the number of independent experiments. Scale bars are 200 µm. Source data are provided as a Source Data file.

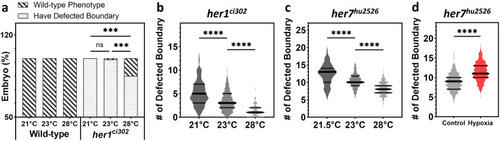
Environmental factors affect the strength of segmentation phenotypes.

a Embryo percentage of wild-type and her1ci302 mutants raised at 21 °C, 23 °C, and 28 °C based on segmentation phenotype. Wild-type embryos have intact boundaries at all temperatures (n = 100, N = 12). her1ci302 mutants displaying segmentation defects at 21 °C (n = 78, N = 15), but incomplete penetrance phenotypes at 23 °C (n = 99, N = 15), and 28 °C (n = 100, N = 15). Striped bar denotes embryos with wild-type phenotype, dotted bar denotes defected embryos. P > 0.9999, ***P = 0.0002 and ***P = 0.0003 between embryos raised at 21 °C and 23 °C, 21 °C and 28 °C, and 23 °C and 28 °C, respectively (two-tailed Fisher’s exact test). ns, not significant. b Number of defective boundaries per each side of her1ci302 mutants at different temperatures, 21 °C (n = 156, N = 15), 23 °C (n = 198, N = 15), and 28 °C (n = 200, N = 15). ****P = 0.5355 × 10−7 (21 °C vs 23 °C), ****P < 0.0001 × 10−11 (23 °C vs 28 °C), Kruskal–Wallis ANOVA with Dunn’s multiple-comparison correction. c Number of defective boundaries per each side of her7hu2526 mutants at 21.5 °C (n = 58, N = 1), at 23 °C (n = 192, N = 4), and at 28 °C (n = 198, N = 4). ****P = 0.1305 × 10−4 (21.5 °C vs 23 °C), ****P < 0.0001 × 10−11 (23 °C vs 28 °C), unpaired two-tailed ANOVA without equal standard deviation assumption and with Games-Howell’s multiple comparison test. d Hypoxia (n = 300, N = 4) affects somite segmentation phenotype (controls: n = 300, N = 4). ****P < 0.0001 × 10−11, two-tailed Mann–Whitney U-test. The violin plots show the median (thick black line) and quartiles (thin black lines). n is the number of embryos in (a), and sides in (bd); N is the number of fish pairs in (ac), and number of independent experiments in (d). Source data are provided as a Source Data file.

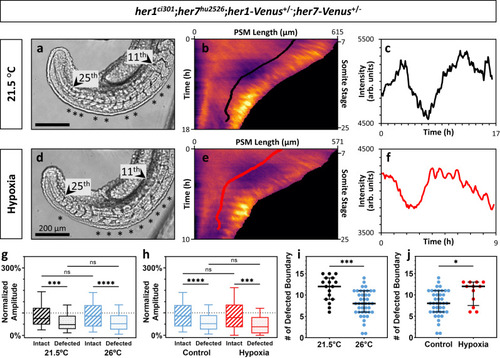
Segmentation clock amplitudes correlate with segmentation phenotypes affected by environmental factors.

af Brightfield images (ad) kymographs (be), and line profiles (cf) along the positions of determination fronts seen on the kymographs for representative her1ci301;her7hu2526;her1-Venus+/-;her7-Venus+/- embryos raised at 21.5 °C (ac, black line), and in hypoxia environment at 26 °C (df, red line) (arbitrary units, arb. units). g, h Normalized amplitudes of waves for intact (black striped, n = 59, N = 2) and defected (black dotted, n = 196, N = 2) boundaries, and intact (red striped, n = 53, N = 2) and defected (red dotted, n = 127, N = 2) boundaries of embryos raised at 21.5 °C (g), and in hypoxia environment at 26 °C (h), respectively, compared with the control embryos (blue) raised at 26 °C. ****P = 0.1496 x 10−7 (26 °C intact vs 26 °C defected), ***P = 0.0008 (21.5 °C intact vs 21.5 °C defected), P > 0.9999 x 10−11 (21.5 °C intact vs 26 °C intact), P > 0.9999 x 10−11 (21.5 °C defected vs 26 °C defected), ****P = 0.7192 x 10−7 (control intact vs control defected), ***P = 0.0007 (hypoxia intact vs hypoxia defected), P = 0.0678 (control defected vs hypoxia defected), P > 0.9999 x 10−11 (control intact vs hypoxia intact), Kruskal–Wallis ANOVA with Dunn’s multiple-comparison correction. ns, not significant. i,j Number of defected boundaries per one side of each embryo raised at 21.5 °C (n = 17, N = 2) (i) and in hypoxic (n = 12, N = 2) conditions (j). Black lines show median (thick), and quartiles (thin). ***P = 0.0002 (21.5 °C vs 26 °C), *P = 0.0135 (control vs hypoxia) two-tailed unpaired t-test. The whisker plots show the median (line), quartiles (box), as well as the 10th and 90th percentiles (whiskers). n is the number of boundaries in (g, h), and embryos in (i, j); N is the number of independent experiments. Source data are provided as a Source Data file.

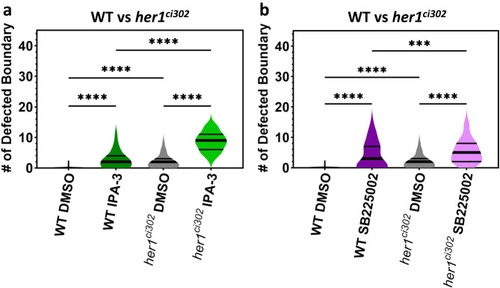
Embryotoxic chemicals worsen segmentation defects.

a, b Number of defective boundaries per each side of wild-type (WT) and her1ci302 mutants treated with 3 µM DMSO (a, b, gray) (n = 172, N = 3, and n = 156, N = 3), 3 µM IPA-3 (a, green) (n = 138, N = 3, and n = 172, N = 3), and 3 µM SB225002 (b, purple) (n = 110, N = 3, and n = 168, N = 3). ****P < 0.0001 × 10−11 (WT DMSO vs WT IPA-3), ****P < 0.0001 × 10−11 (WT DMSO vs her1ci302 DMSO), ****P < 0.0001 × 10−11 (WT IPA-3 vs her1ci302 IPA-3), ****P < 0.0001 × 10−11 (her1ci302 DMSO vs her1ci302 IPA-3), ****P < 0.0001 × 10−11 (WT DMSO vs WT SB225002), ****P < 0.0001 × 10−11 (WT DMSO vs her1ci302 DMSO), ***P = 0.0001 (WT SB225002 vs her1ci302 SB225002), ****P = 0.4647 × 10−11 (her1ci302 DMSO vs her1ci302 SB225002), Kruskal–Wallis ANOVA with Dunn’s multiple-comparison correction. The violin plots show the median (thick black line) and quartiles (thin black lines). n is the number of sides; N is the number of independent experiments. Source data are provided as a Source Data file.

Acknowledgments
This image is the copyrighted work of the attributed author or publisher, and ZFIN has permission only to display this image to its users. Additional permissions should be obtained from the applicable author or publisher of the image. Full text @ Nat. Commun.