IMAGE

Fig. 1

ID
ZDB-IMAGE-231023-21
Source
Figures for Keseroglu et al., 2023
Image
Figure Caption

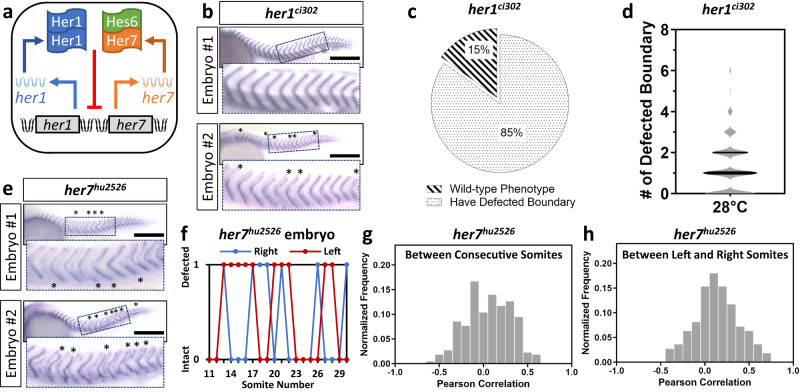
Fig. 1 Segmentation defects in mutants are stochastic.

a Her1-Her1 and Her7-Hes6 dimers form a negative feedback loop by repressing their own transcription. b Somite boundaries are marked by xirp2 ISH staining in sibling her1ci302 mutant embryos. While the upper embryo has no segmentation defect, lower embryo has 6 defective segmentation boundaries (marked by the star). Insets show 500-µm-wide enlarged images of boundaries. Scale bar is 300 µm. c, d Percentage of her1ci302 mutants displaying wild-type phenotype (striped) or segmentation defects (dotted) at 28 °C (c, n = 50, N = 15), and number of defective boundaries per each side of her1ci302 mutants (d, n = 100, N = 15). The violin plot shows the median (thick black line) and quartiles (thin black lines). exirp2 ISH staining of her7hu2526 mutants. Insets show 500-µm-wide enlarged images of boundaries. Scale bar is 300 µm. f Scoring of segmentation defect position of one her7hu2526 mutant embryo raised at 28 °C. g The Pearson correlation of same side consecutive somite phenotype (n = 222, N = 3), and (h) same position left- and right-side somite phenotype (n = 111, N = 3) between 11th and 30th somite boundaries. n is the number of embryos in (c, h), and sides in (d, g); N is the number of fish pairs in (c, d), and number of independent experiments in (g, h). Source data are provided as a Source Data file.

Acknowledgments
This image is the copyrighted work of the attributed author or publisher, and ZFIN has permission only to display this image to its users. Additional permissions should be obtained from the applicable author or publisher of the image. Full text @ Nat. Commun.