IMAGE

Fig. 5

ID
ZDB-IMAGE-231023-25
Source
Figures for Keseroglu et al., 2023
Image
Figure Caption

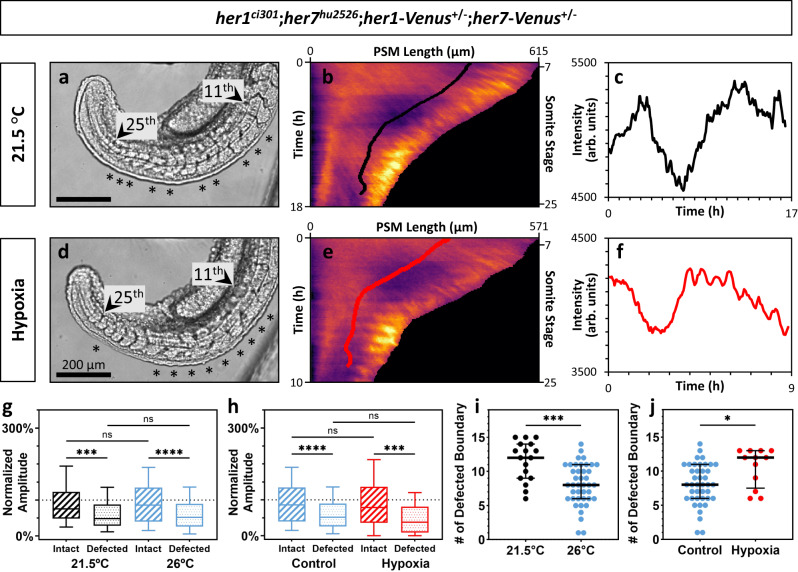
Fig. 5 Segmentation clock amplitudes correlate with segmentation phenotypes affected by environmental factors.

af Brightfield images (ad) kymographs (be), and line profiles (cf) along the positions of determination fronts seen on the kymographs for representative her1ci301;her7hu2526;her1-Venus+/-;her7-Venus+/- embryos raised at 21.5 °C (ac, black line), and in hypoxia environment at 26 °C (df, red line) (arbitrary units, arb. units). g, h Normalized amplitudes of waves for intact (black striped, n = 59, N = 2) and defected (black dotted, n = 196, N = 2) boundaries, and intact (red striped, n = 53, N = 2) and defected (red dotted, n = 127, N = 2) boundaries of embryos raised at 21.5 °C (g), and in hypoxia environment at 26 °C (h), respectively, compared with the control embryos (blue) raised at 26 °C. ****P = 0.1496 x 10−7 (26 °C intact vs 26 °C defected), ***P = 0.0008 (21.5 °C intact vs 21.5 °C defected), P > 0.9999 x 10−11 (21.5 °C intact vs 26 °C intact), P > 0.9999 x 10−11 (21.5 °C defected vs 26 °C defected), ****P = 0.7192 x 10−7 (control intact vs control defected), ***P = 0.0007 (hypoxia intact vs hypoxia defected), P = 0.0678 (control defected vs hypoxia defected), P > 0.9999 x 10−11 (control intact vs hypoxia intact), Kruskal–Wallis ANOVA with Dunn’s multiple-comparison correction. ns, not significant. i,j Number of defected boundaries per one side of each embryo raised at 21.5 °C (n = 17, N = 2) (i) and in hypoxic (n = 12, N = 2) conditions (j). Black lines show median (thick), and quartiles (thin). ***P = 0.0002 (21.5 °C vs 26 °C), *P = 0.0135 (control vs hypoxia) two-tailed unpaired t-test. The whisker plots show the median (line), quartiles (box), as well as the 10th and 90th percentiles (whiskers). n is the number of boundaries in (g, h), and embryos in (i, j); N is the number of independent experiments. Source data are provided as a Source Data file.

Acknowledgments
This image is the copyrighted work of the attributed author or publisher, and ZFIN has permission only to display this image to its users. Additional permissions should be obtained from the applicable author or publisher of the image. Full text @ Nat. Commun.