IMAGE

Fig. 6

ID
ZDB-IMAGE-231023-26
Source
Figures for Keseroglu et al., 2023
Image
Figure Caption

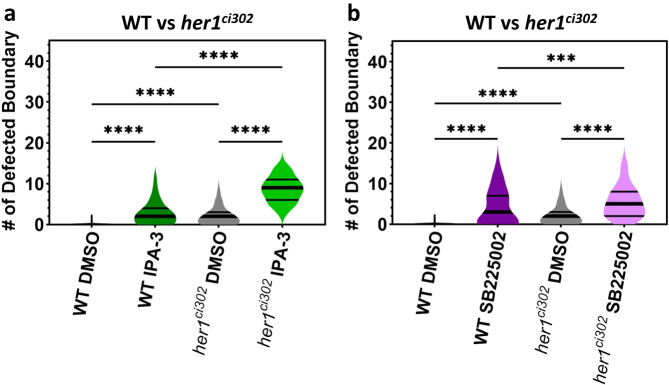
Fig. 6 Embryotoxic chemicals worsen segmentation defects.

a, b Number of defective boundaries per each side of wild-type (WT) and her1ci302 mutants treated with 3 µM DMSO (a, b, gray) (n = 172, N = 3, and n = 156, N = 3), 3 µM IPA-3 (a, green) (n = 138, N = 3, and n = 172, N = 3), and 3 µM SB225002 (b, purple) (n = 110, N = 3, and n = 168, N = 3). ****P < 0.0001 × 10−11 (WT DMSO vs WT IPA-3), ****P < 0.0001 × 10−11 (WT DMSO vs her1ci302 DMSO), ****P < 0.0001 × 10−11 (WT IPA-3 vs her1ci302 IPA-3), ****P < 0.0001 × 10−11 (her1ci302 DMSO vs her1ci302 IPA-3), ****P < 0.0001 × 10−11 (WT DMSO vs WT SB225002), ****P < 0.0001 × 10−11 (WT DMSO vs her1ci302 DMSO), ***P = 0.0001 (WT SB225002 vs her1ci302 SB225002), ****P = 0.4647 × 10−11 (her1ci302 DMSO vs her1ci302 SB225002), Kruskal–Wallis ANOVA with Dunn’s multiple-comparison correction. The violin plots show the median (thick black line) and quartiles (thin black lines). n is the number of sides; N is the number of independent experiments. Source data are provided as a Source Data file.

Acknowledgments
This image is the copyrighted work of the attributed author or publisher, and ZFIN has permission only to display this image to its users. Additional permissions should be obtained from the applicable author or publisher of the image. Full text @ Nat. Commun.