
- Title
-
Knockout of Katnal2 Leads to Autism-like Behaviors and Developmental Delay in Zebrafish
- Authors
- Zheng, J., Long, F., Cao, X., Xiong, B., Li, Y.
- Source
- Full text @ Int. J. Mol. Sci.
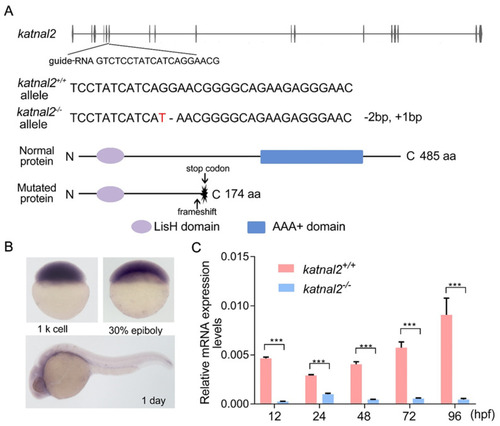
Generation of katnal2-/- allele by CRISPR/Cas9 gene-editing technology. (A) Structure of zebrafish katnal2 gene. The protein includes an N-terminal LisH (Lis-homology) domain and a C-terminal AAA catalytic domain. A guide-RNA was designed to target a 23 bp region in exon 6. The katnal2-/- allele contains a 2-base deletion and a 1-base insertion. The red color indicates the inserted nucleotides and the “-” indicates the deleted nucleotides. The mutation causes frameshift and early truncation of the protein prior to the AAA+ domain. (B) The expression pattern of katnal2 in the early embryonic development determined by in situ hybridization. (C) The expression level of katnal2 mRNA in katnal2+/+ (pink) and katnal2-/- (blue) alleles. Data are shown as mean ± S.E.M.; *** indicates p < 0.001. |
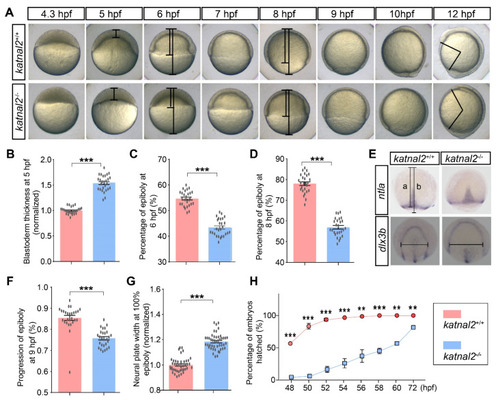
Katnal2-/- embryos exhibited developmentally delayed phenotypes. (A) Images of the embryos in time series from the initiation until the finish of epiboly. Images are lateral views with the animal pole on the top. (B) Normalized blastoderm thickness of the katnal2+/+ and katnal2-/- embryos at 5 hpf (+/+, N = 26; -/-, N = 27). (C,D) The epiboly progression at 6 hpf and 8 hpf (N = 27 for each genotype) measured as indicated in panel (A). (E) Expression patterns of ntla in 9 hpf embryos and dlx3b in 100% epiboly embryos were analyzed by in situ hybridization. The line “a” represents the distance from the animal pole to the boundary of epiboly movement. The line “b” represents the distance between the animal and the plant pole. The horizontal line in dlx3b staining results represents the width of the neural plate. (F) katnal2-/- embryos exhibited epiboly movement delay at 9 hpf as determined by ntla staining (N = 27 for each genotype). (G) Normalized neural plate width determined by dlx3b staining at 100% epiboly stage (+/+, N = 43; -/-, N = 46). (H) Percentage of embryos hatched was recorded every 2 h from 48 hpf to 60 hpf. Data are shown as mean ± S.E.M.; ** indicates p < 0.01, and *** indicates p < 0.001. |
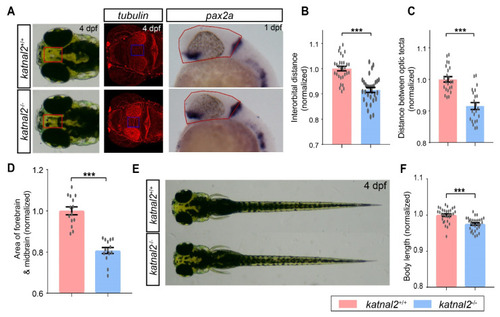
Katnal2-/- larvae displayed morphological changes. (A) Illustrations of the measurements of the distance between the eyes, the distance between the optic tecta, and the area of forebrain and midbrain. (B) Comparisons of the normalized interorbital distance of 4 dpf katnal2+/+ and katnal2-/- larvae (N = 30 for each genotype). (C) Normalized width between optic tecta of 4 dpf larvae (+/+, N = 23; -/-, N = 22). (D) Normalized area of the forebrain and midbrain region for 1 dpf embryos as determined by pax2a staining (N = 14 for each genotype). (E,F) Comparison of the body length of 4 dpf katnal2+/+ and katnal2-/- larvae (N = 30 for each genotype). Data are shown as mean ± S.E.M.; *** indicates p < 0.001. |
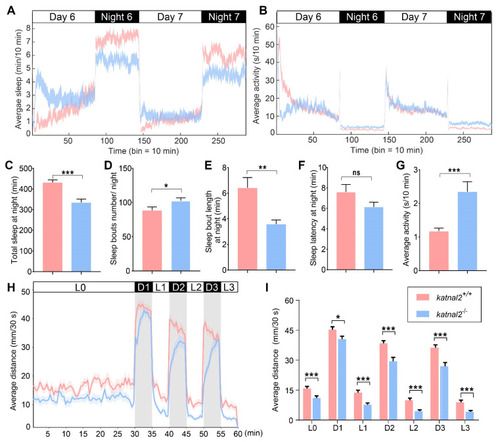
Katnal2-/- larvae displayed abnormal sleep/awake patterns and impaired locomotion activity. (A) Time sequence diagram of average sleep over time (N = 48 for each genotype). White and black bars above behavioral traces indicate the day (14 h) and night (10 h), respectively. (B) Time sequence diagram of average total activity over time. (C) Total sleep length on the sixth night. (D) Sleep bouts number on the sixth night. (E) Sleep bouts duration on the sixth night. (F) Sleep latency after light-off on the sixth night. (G) Average total waking activity on the sixth night. (H) The average distance moved within each 30 s bin under either light or dark conditions is plotted (N = 48 for each genotype). White and black bars above the behavioral traces indicate light (30 min or 5 min) and dark (5 min) conditions, respectively. (I) The average distance moved in 30 s during 30 min of light and three 5-min light/dark intervals. Data are shown as mean ± S.E.M.; * indicates p < 0.05, ** indicates p < 0.01, *** indicates p < 0.001 and ns indicates no significance. |
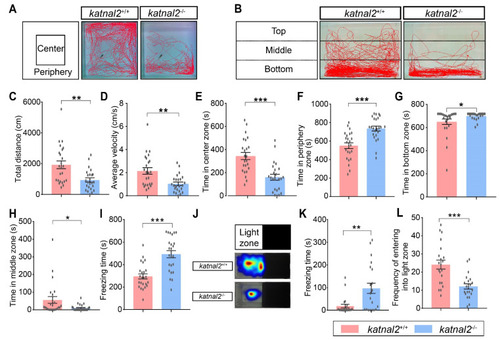
Adult katnal2-/- zebrafish displayed reduced locomotion activity and anxiety-like behaviors. (A) Schematic diagram of the open-field test and representative trajectory diagrams (N = 24 for each genotype). (B) Schematic diagram of the novel tank test and representative trajectory diagrams (N = 24 for each genotype). (C) The total distance moved in the open field test. (D) The average velocity in the open field test. (E) Duration time in the center zone. (F) Duration time in the peripheral zone. (G) Duration time in the bottom zone in the novel tank test. (H) Duration time in the middle zone in the novel tank test. (I) The freezing time in the novel tank test. (J) Schematic diagram of the light-and-dark test and heat map of sojourn time (N = 21 for each genotype). (K) The freezing time in the light zone. (L) The frequency of the tester zebrafish entering the light zone. Data are shown as mean ± S.E.M.; * indicates p < 0.05, ** indicates p < 0.01, and *** indicates p < 0.001. |
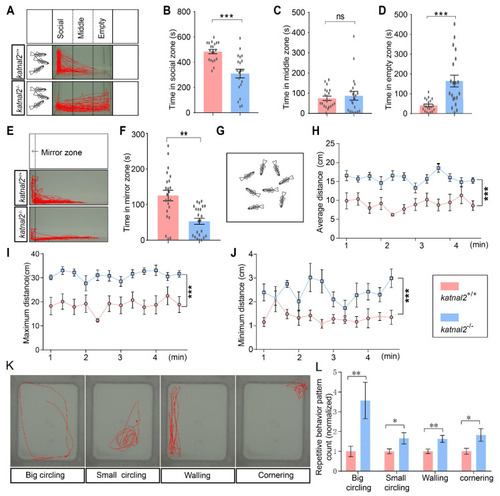
Katnal2-/- zebrafish showed impaired social interaction and reduced social cohesion. (A) Schematic diagram of the three-tank social interaction test and representative trajectory diagrams (N = 20 for each genotype). (B) Duration time in the social zone. (C) Duration time in the middle zone. (D) Duration time in the empty zone. (E) Schematic diagram of the mirror test and representative trajectory diagrams (+/+, N = 22; -/-, N = 23). (F) Duration time in the mirror zone. (G) Schematic diagram of the shoaling test (N = 9 for each genotype). (H) The average inter-fish distance was recorded and calculated every 20 s. (I) The maximum inter-fish distance was recorded and calculated every 20 s. (J) The minimum inter-fish distance was recorded and calculated every 20 s. (K) Representative trace of big circling, small circling, and walling. (L) Comparison of the frequency of different repetitive behaviors between katnal2 mutants and controls (N = 45 for each phenotype). Data are shown as mean ± S.E.M.; * indicates p < 0.05, ** indicates p < 0.01, and *** indicates p < 0.001 and ns indicates no significance. |