
|
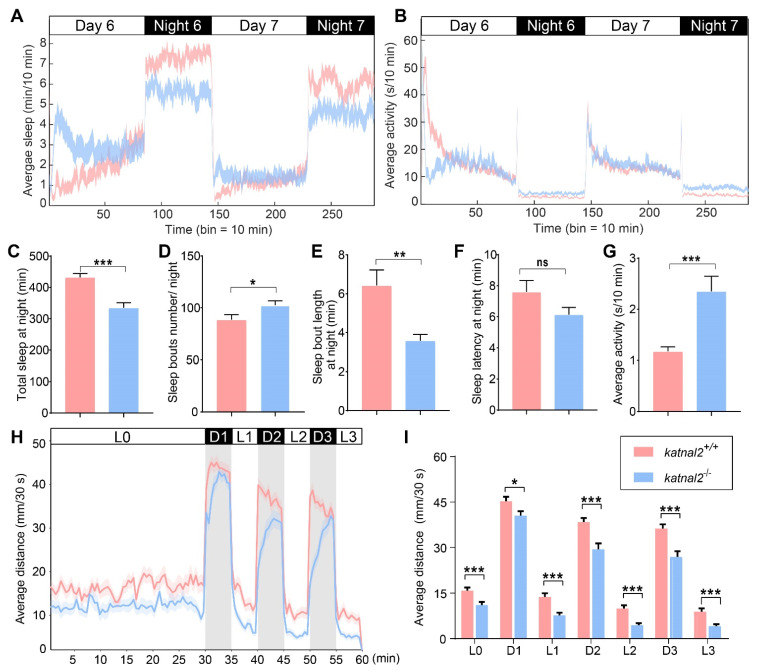
Fig. 4
Katnal2-/- larvae displayed abnormal sleep/awake patterns and impaired locomotion activity. (A) Time sequence diagram of average sleep over time (N = 48 for each genotype). White and black bars above behavioral traces indicate the day (14 h) and night (10 h), respectively. (B) Time sequence diagram of average total activity over time. (C) Total sleep length on the sixth night. (D) Sleep bouts number on the sixth night. (E) Sleep bouts duration on the sixth night. (F) Sleep latency after light-off on the sixth night. (G) Average total waking activity on the sixth night. (H) The average distance moved within each 30 s bin under either light or dark conditions is plotted (N = 48 for each genotype). White and black bars above the behavioral traces indicate light (30 min or 5 min) and dark (5 min) conditions, respectively. (I) The average distance moved in 30 s during 30 min of light and three 5-min light/dark intervals. Data are shown as mean ± S.E.M.; * indicates p < 0.05, ** indicates p < 0.01, *** indicates p < 0.001 and ns indicates no significance.