
|
Fig. 6
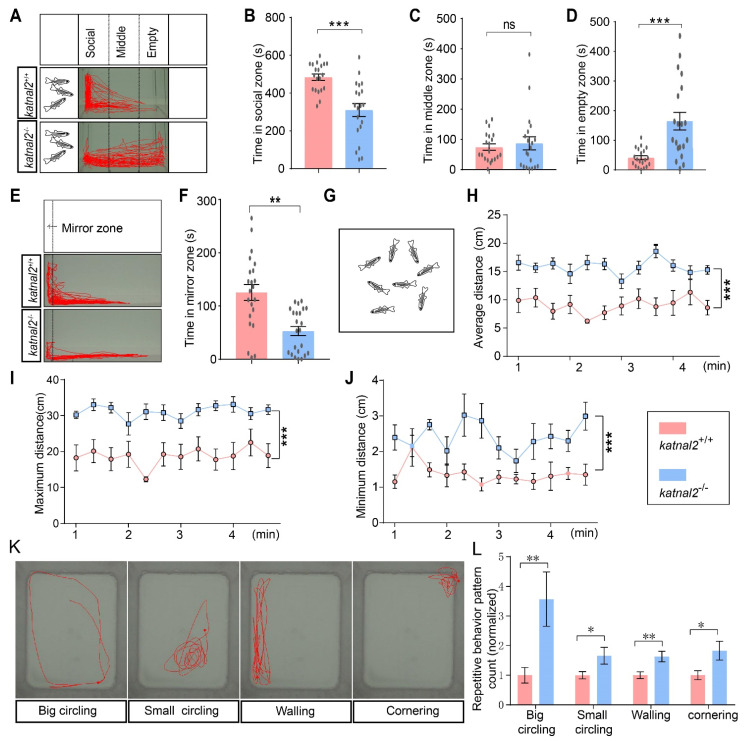
Katnal2-/- zebrafish showed impaired social interaction and reduced social cohesion. (A) Schematic diagram of the three-tank social interaction test and representative trajectory diagrams (N = 20 for each genotype). (B) Duration time in the social zone. (C) Duration time in the middle zone. (D) Duration time in the empty zone. (E) Schematic diagram of the mirror test and representative trajectory diagrams (+/+, N = 22; -/-, N = 23). (F) Duration time in the mirror zone. (G) Schematic diagram of the shoaling test (N = 9 for each genotype). (H) The average inter-fish distance was recorded and calculated every 20 s. (I) The maximum inter-fish distance was recorded and calculated every 20 s. (J) The minimum inter-fish distance was recorded and calculated every 20 s. (K) Representative trace of big circling, small circling, and walling. (L) Comparison of the frequency of different repetitive behaviors between katnal2 mutants and controls (N = 45 for each phenotype). Data are shown as mean ± S.E.M.; * indicates p < 0.05, ** indicates p < 0.01, and *** indicates p < 0.001 and ns indicates no significance.