Fig. 3
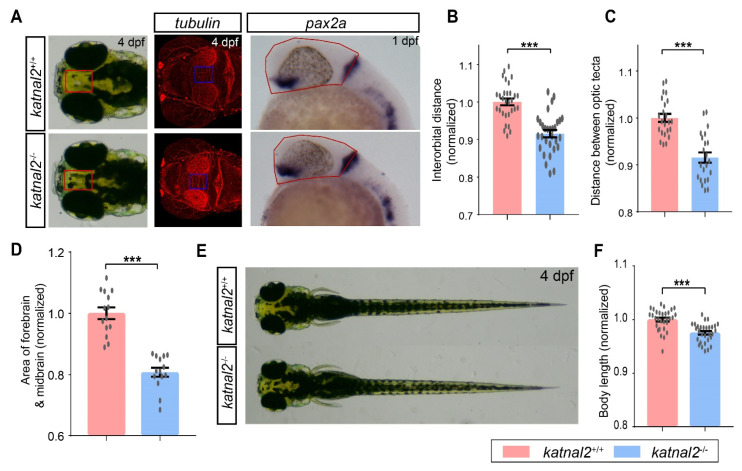
Katnal2-/- larvae displayed morphological changes. (A) Illustrations of the measurements of the distance between the eyes, the distance between the optic tecta, and the area of forebrain and midbrain. (B) Comparisons of the normalized interorbital distance of 4 dpf katnal2+/+ and katnal2-/- larvae (N = 30 for each genotype). (C) Normalized width between optic tecta of 4 dpf larvae (+/+, N = 23; -/-, N = 22). (D) Normalized area of the forebrain and midbrain region for 1 dpf embryos as determined by pax2a staining (N = 14 for each genotype). (E,F) Comparison of the body length of 4 dpf katnal2+/+ and katnal2-/- larvae (N = 30 for each genotype). Data are shown as mean ± S.E.M.; *** indicates p < 0.001.

