
|
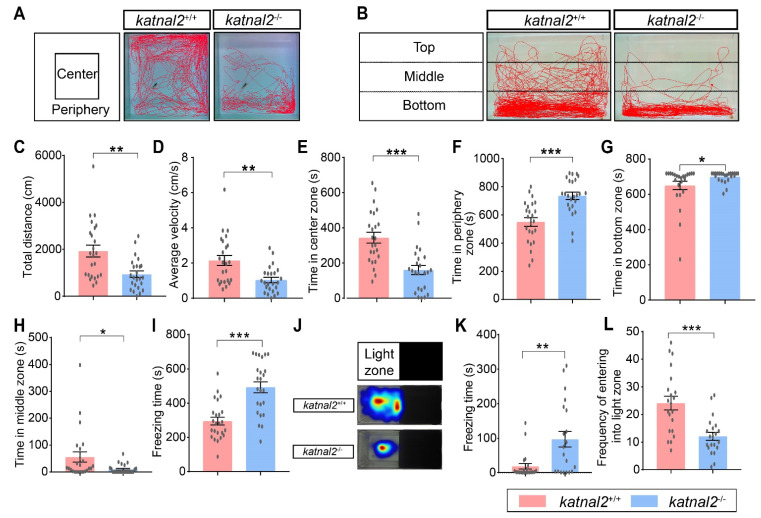
Fig. 5
Adult katnal2-/- zebrafish displayed reduced locomotion activity and anxiety-like behaviors. (A) Schematic diagram of the open-field test and representative trajectory diagrams (N = 24 for each genotype). (B) Schematic diagram of the novel tank test and representative trajectory diagrams (N = 24 for each genotype). (C) The total distance moved in the open field test. (D) The average velocity in the open field test. (E) Duration time in the center zone. (F) Duration time in the peripheral zone. (G) Duration time in the bottom zone in the novel tank test. (H) Duration time in the middle zone in the novel tank test. (I) The freezing time in the novel tank test. (J) Schematic diagram of the light-and-dark test and heat map of sojourn time (N = 21 for each genotype). (K) The freezing time in the light zone. (L) The frequency of the tester zebrafish entering the light zone. Data are shown as mean ± S.E.M.; * indicates p < 0.05, ** indicates p < 0.01, and *** indicates p < 0.001.