
|
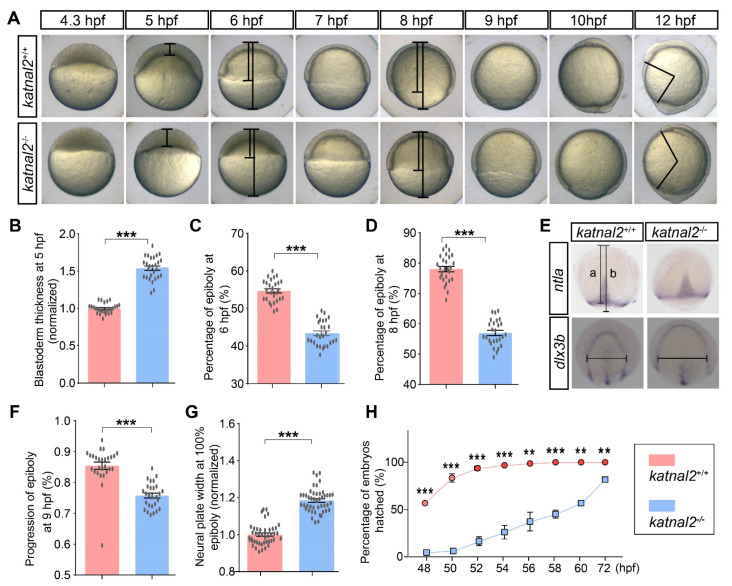
Fig. 2
Katnal2-/- embryos exhibited developmentally delayed phenotypes. (A) Images of the embryos in time series from the initiation until the finish of epiboly. Images are lateral views with the animal pole on the top. (B) Normalized blastoderm thickness of the katnal2+/+ and katnal2-/- embryos at 5 hpf (+/+, N = 26; -/-, N = 27). (C,D) The epiboly progression at 6 hpf and 8 hpf (N = 27 for each genotype) measured as indicated in panel (A). (E) Expression patterns of ntla in 9 hpf embryos and dlx3b in 100% epiboly embryos were analyzed by in situ hybridization. The line “a” represents the distance from the animal pole to the boundary of epiboly movement. The line “b” represents the distance between the animal and the plant pole. The horizontal line in dlx3b staining results represents the width of the neural plate. (F) katnal2-/- embryos exhibited epiboly movement delay at 9 hpf as determined by ntla staining (N = 27 for each genotype). (G) Normalized neural plate width determined by dlx3b staining at 100% epiboly stage (+/+, N = 43; -/-, N = 46). (H) Percentage of embryos hatched was recorded every 2 h from 48 hpf to 60 hpf. Data are shown as mean ± S.E.M.; ** indicates p < 0.01, and *** indicates p < 0.001.