FIGURE SUMMARY
Title

Synergistic prostaglandin E synthesis by myeloid and endothelial cells promotes fetal hematopoietic stem cell expansion in vertebrates

Authors
Cacialli, P., Mailhe, M.P., Wagner, I., Merkler, D., Golub, R., Bertrand, J.Y.
Source
Full text @ EMBO J.

The PGE2 synthesis pathway in zebrafish CHT

  • A
    Experimental outline of qPCR analysis after dissection of CHT (caudal region) at 48 hpf from kdrl:GFP, ikaros:GFP, mpeg1:GFP, mpx:GFP transgenic animals, and FACS‐sorted GFP‐positive cells to purify ECs, HSPCs, macrophages, and neutrophils.
  • B, C
    The phospholipases pla2g4aa and pla2g4ab are highly expressed in neutrophils.
  • D–F
    The expression of cyclooxygenases cox1, cox2a, and cox2b is enriched in macrophages.
  • G, H
    The prostaglandin synthases ptges3a and ptges3b are only expressed by ECs.
  • I–M
    The prostaglandin receptors ptger1a, ptger1b, ptger2a, ptger3, and ptger4a are mostly expressed in HSPCs.
  • N, O
    The prostaglandin transporters slco2b1 and abcc4 are specifically expressed in ECs.

Data information: For each panel, data represent biological triplicates plated in technical duplicates. Statistical analysis was completed using one‐way ANOVA and multiple comparison tests. *P < 0.05; **P < 0.01; ***P < 0.001; ****P < 0.0001. Center values denote the mean, and error bars denote s.e.m.

Source data are available online for this figure.

The loss of HSCs after myeloid ablation can be rescued by PGE2 or PGH2 treatments

  • A
    Schematic indicating the imaging area in the tail at 72 hpf, as indicated by the black box; fluorescence imaging of the CHT in double transgenic cd45:CFP‐NTR/runx1:mcherry embryos in DMSO and after treatment with MTZ and PGH2 or PGE2.
  • B
    Quantification of runx1:mcherry‐positive cells in double transgenic cd45:CFP‐NTR/runx1:mcherry embryos in DMSO and after treatment with MTZ and PGH2 or PGE2.
  • C
    Quantification of cd45:CFP‐positive cells in double transgenic cd45:CFP‐NTR/runx1:mcherry embryos in DMSO and after treatment with MTZ and PGH2 or PGE2.

Data information: Statistical analysis was completed using one‐way ANOVA and multiple comparison tests. *P < 0.05; **P < 0.01; ***P < 0.001; ****P < 0.0001. Scale bar is 200 μm (A).

Source data are available online for this figure.

The deficiency of slco2b1 induces a decrease of HSPC in the CHT

  • A
    WISH for cmyb expression at 60 hpf in wild‐type and slco2b1 −/− embryos.
  • B
    Quantification of cmyb‐expressing cells. Each n represents the number of cmyb‐expressing cells for each embryo (biological replicates). Each experiment has been repeated three independent times.
  • C
    Schematic indicating the imaging area in the tail at 60 hpf, as indicated by the black box; fluorescence imaging in the CHT of kdrl:mCherry;cmyb:GFP embryos injected with control‐ and slco2b1‐Mos.
  • D
    Quantification of HSPCs associated with ECs. Each n represents the number of yellow spots for each embryo (biological replicates). Each experiment has been repeated three independent times.
  • E
    Experimental outline and quantification of time‐lapse live imaging in controls and slco2b1‐morphants cmyb:GFP + cells, using Imaris software.

Data information: Center values denote the mean, and error values denote s.e.m. The statistical analysis was completed using an unpaired two‐tailed t‐test. ***P < 0.001. Scale bar is 500 μm (A); 200 μm (C).

Source data are available online for this figure.

The defect in HSPCs proliferation in slco2b1‐deficient embryos can be rescued by PGE2 treatment

  • A
    Anti‐GFP and pH3 immunostainings of either controls (Ctrl‐Mo) or slco2b1‐morphants (slco2b1‐MO) cmyb:GFP embryos.
  • B
    Quantification of the number of the pH3+ HSCs in controls or slco2b1‐morphants. Center values denote the mean, and error values denote s.e.m, statistical analysis was completed using an unpaired two‐tailed t‐test. ***P < 0.001.
  • C
    Experimental outline to measure PGE2 level by ELISA kit in control and slco2b1‐MO at 60 hpf.
  • D
    Quantification of PGE2 concentration in control‐ and slco2b1‐morphants. The statistical analysis was completed using an unpaired two‐tailed t‐test *P < 0.01. Center values denote the mean, and error bars denote s.e.m.
  • E
    Fluorescence imaging in the CHT of cmyb:GFP embryos injected with control‐ and slco2b1‐MOs and treated with PGE2.
  • F
    Quantification of GFP‐positive cells. Statistical analysis: one‐way ANOVA, multiple comparison, *P < 0.01; ****P < 0.0001. Center values denote the mean, and error bars denote s.e.m. Data information: Scale bar is 50 μm (A); 200 μm (E).

Source data are available online for this figure.

Slco2b1 is necessary to import PGH2 into ECs

  • A
    Fluorescence imaging of the CHT of double transgenic cd45:CFP‐NTR/runx1:mcherry embryos injected with control‐ or slco2b1‐morpholinos, after treatment with DMSO.
  • B
    Fluorescence imaging of the CHT of double transgenic cd45:CFP‐NTR/runx1:mcherry embryos injected with control‐ or slco2b1‐morpholinos, after treatment with DMSO+MTZ.
  • C
    Fluorescence imaging of the CHT of double transgenic cd45:CFP‐NTR/runx1:mcherry embryos injected with control‐ or slco2b1‐morpholinos, after treatment with DMSO+MTZ + PGH2.
  • D
    Quantification of runx1:mcherry‐positive cells. Each dot represents the number of red cells for each embryo (biological replicates). Each experiment has been repeated three independent times.
  • E
    Quantification of cd45:CFP‐positive cells. Each dot represents the number of blue cells for each embryo (biological replicates). Each experiment has been repeated three independent times. Data information for (D) and (E): Statistical analysis was completed using one‐way ANOVA and multiple comparison tests. ****P < 0.0001. Center values denote the mean, and error bars denote s.e.m.

Scale bar is 200 μm (A–C).

Source data are available online for this figure.

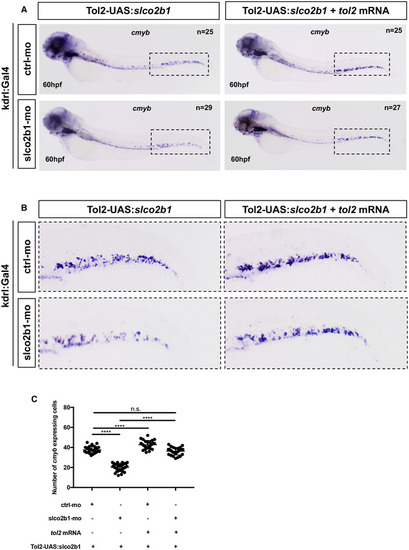
Slco2b1‐overexpression in ECs can rescue the loss of HSPCs in slco2b1‐ morphants

  • A,B
    (A) WISH for cmyb at 60hpf in kdrl:Gal4+ embryos injected with control‐ and slco2b1‐ morpholinos and/or co‐injected with the Tol2‐UAS:slco2b1 vector and tol2 mRNA. The region indicated by the dashed has been magnified and shown in (B).
  • C
    Quantification and statistical analysis were completed using one‐way ANOVA and multiple comparison tests. ****P < 0.0001. Center values denote the mean, and error bars denote s.e.m. Each dot represents the number of cmyb‐expressing cells for each embryo (biological replicates). Each experiment has been repeated three independent times.

Source data are available online for this figure.

The expression of the prostaglandin synthesis pathway is conserved between the zebrafish CHT and the mouse fetal liver

  • A, B
    (A) Summary of prostaglandin gene expression pathways in the CHT of zebrafish, and (B) in mouse FL. The different symbols correspond to the C t value to which the threshold of detection was applied during the analysis of the qPCR: very high expression (++++) C t < 24; high expression (+++) 25 < C t < 28; medium expression (++) 29 < C t < 32; low expression (+) 33 < C t < 36; very low to no expression (−) C t > 37.
  • C
    Proposal mechanism in which HSCs, ECs, macrophages and neutrophils cooperate in the embryonic niche. In normal conditions (upper panel) slco2b1 permits the transfer of PGE2 precursors in ECs. The deficiency of slco2b1 (lower panel) decreases PGE2 levels in the CHT niche, generating a defect of HSC proliferation.

Source data are available online for this figure.

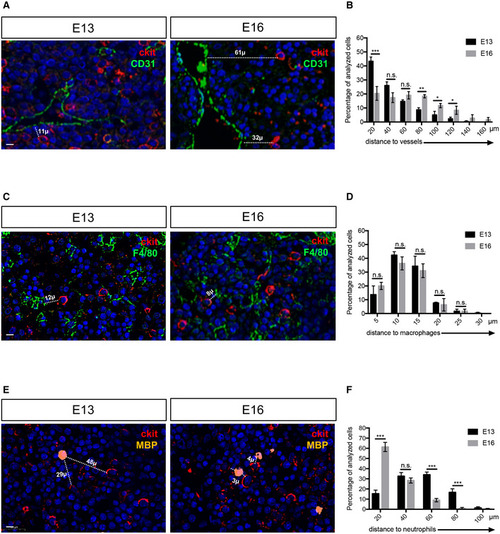
Myeloid and endothelial cells are very close to HSPCs in the mouse fetal liver

  • A
    Immunohistochemistry on paraffin sections for cKit (HSPCs marker) and CD31 (endothelial cell marker) at E13 and E16 stages of mouse fetal liver.
  • B
    Distance distribution between cKithigh cells and endothelial cells (n = 79 from three E13 fetal livers; n = 92 from three E16 fetal livers), binned into 20 μm intervals. Statistical analysis was completed using a t‐test. *P < 0.01; **P < 0.001; ***P < 0.0001. Center values denote the mean, and error values denote s.e.m.
  • C
    Immunohistochemistry on paraffin sections for cKit (HSPCs marker) and F4/80 (macrophage cell marker) at E13 and E16 stages of mouse fetal liver.
  • D
    Distance distribution between cKithigh cells and macrophages (n = 54 from three E13 fetal livers; n = 64 from three E16 fetal livers), binned into 5 μm intervals. Statistical analysis was completed using a t‐test.
  • E
    Immunohistochemistry on paraffin sections for cKit (HSPCs marker) and MBP (neutrophil cell marker) at E13 and E16 stages of mouse fetal liver.
  • F
    Distance distribution between cKithigh cells and neutrophils (n = 45 from three E13 fetal livers; n = 53 from three E16 fetal livers), binned into 20 μm intervals. Statistical analysis was completed using a t‐test ***P < 0.001.

Data information: All nuclei were marked with DAPI. Scale bar is 20 μm (A–C–E).

Acknowledgments
This image is the copyrighted work of the attributed author or publisher, and ZFIN has permission only to display this image to its users. Additional permissions should be obtained from the applicable author or publisher of the image. Full text @ EMBO J.